
Parts 1, 2, 3, 4 and 6 may be accessed here.
Until the industrial revolution 200 years ago, the balance of carbon was largely determined by natural processes. At a level of about 280 ppm, atmospheric carbon di-oxide was in equilibrium with the rest of the carbon in the ecosystem. A strong volcanic eruption or higher number of forest fires might disturb the equilibrium for a short while but things were fairly stable. In the past 200 years, human activity has not only changed the land profile through deforestation and extensive farming, but humans have been burning fossil fuels that converts historic carbon ( coal, petroleum and natural gas buried underground millions of years ago) into CO2 and releases it into the atmosphere.
The increased concentration of CO2 in the atmosphere results in other parts of the ecosystem absorbing more CO2 to reach a balance between atmospheric and land & oceanic carbon di-oxide. However, only half of the CO2 sent to the atmosphere by human activity is removed by rebalancing the carbon cycle - the other half mixes with atmospheric gases and results in an overall increase of long term CO2 concentration in the atmosphere. This value has gone up from 280 ppm in year 1800 to 410+ ppm in 2019. The inevitable global warming effect has been observed to have warmed the land mass of the Earth on average by 1.1C; the sea surface temperature has risen by about 0.13C per decade over the past 100 years.
The exchange of carbon among different components of the ecosystem is described by the Carbon Cycle. Oceans and soils hold the major fraction of carbon at the Earth's surface - in the form of dissolved CO2 in the oceans and organic carbon in the soil. Carbon inventory of the oceans is sensitive to the surface water temperature - CO2 is less soluble in warmer waters (solubility decreases by about 3% per degree centigrade rise in temperature) and may reduce the ability of oceans to remove CO2 in future. Deforestation and land clearance increase loss of carbon from the land. The two slides show a highly simplified view of the carbon cycle. - (Click here for a more detailed description)

The slide provides a good summary of carbon exchange in the ecosystem. Most exchange happens through CO2 in the atmosphere.
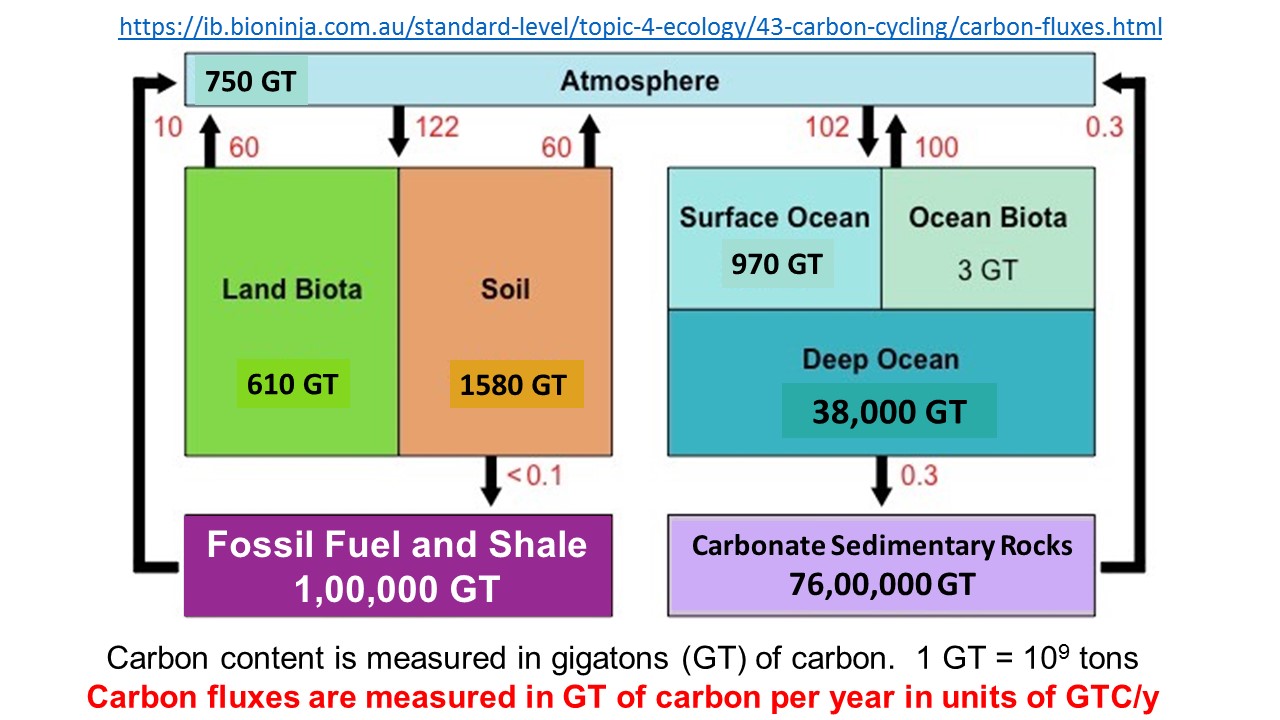
Notice that the largest store of carbon is in the form of carbonate sedimentary rocks made up primarily from buried dead coral and shells of sea-creatures. They are mostly carbonates of calcium and magnesium. During cement manufacturing, calcium carbonate is heated and CO2 is released to the atmosphere - this provides an additional important contribution.
In slide 2, the numbers in red give the rate of carbon release in gigatons per year (GTC/y). For comparison, volcanic activity, on average, puts 0.1 GTC/y CO2 into the atmosphere. The major recent addition is the burning of fossil fuels by humans at 10 GTC/y.
 The box on the right (Click on the box to expand) explains the confusing use of carbon and CO2
 interchangeably. Because carbon is in many different forms in various inventories, it is more convenient to talk of carbon amount than of CO2.
The Keeling Curve: In 1958, Charles Keeling (1928 - 2005) started measuring CO2 concentration in the atmosphere at the Mauna Loa Observatory (Hawaii). Keeling curve provides a record of the progressive build-up of atmospheric CO2. Keeling first alerted the world of human activity driven greenhouse effect and global warming.
The slide shows the Keeling curve as of 2019. Notice the ability of the measurements to pick up the variation of CO2 levels during the year. In Northern hemisphere, plants use CO2 during the growth period from April to October and respire CO2 during the winter months. This shows up as an oscillatory signature superimposed on the annual trend of atmospheric CO2 concentration. The slide is adapted from Data from Dr. Pieter Tans, NOAA/ESRL and Dr. Ralph Keeling, Scripps Institution of Oceanography.

In Part 6, I shall explain how we can determine the contribution of human activity to the increasing amount of CO2 in the atmosphere. In fact, as we shall see, almost all the increase in CO2 levels may be credited to human activity with natural variations playing an insignificant role.
No comments:
Post a Comment