
Index of Blogs and Courses
COP25 in Madrid has ended and COP26 will happen in Glasgow next year to continue the discussions. Everybody has been disappointed that COP25 did not achieve anything of value - I am surprised that people were disappointed. COPs are talking shops where they say good words and express concerns but by their very structure, they are not supposed to achieve anything much of value. This has been going on since Kyoto 1997. Paris 2015 was important as it seemed that at least it was realised that global warming should be limited to below 2C in 2100 but ideally attempts would be made to keep it no more than 1.5C. I did not believe anything will happen, and I said that again before COP25 and I do not believe much will change in COP26. The world will continue to aggravate global warming, and 3 to 4C rise by 2100 is well on the cards.
The situation is really very simple and there are several flaws in the whole process:
To start with, number one reason that has been driving global warming is never seriously on the agenda - population growth. More than 2.5 billion people in China and India have joined the over-consumption binge of the developed OECD countries in a big way. Even on the assumption that global population might stabilise by year 2100, consumption from other Asian and African countries will continue to drive the need for more energy - burning more fossil fuels and aggravating global warming further.
A second problem in meeting any global warming target is what I call the 'Coal Trap'. The world faces a dilemma about how to produce the energy required to maintain a decent functionality and meeting peoples' aspirations for better standard of living. There is no technological solution in sight that will rid us of consuming fossil fuels by 2050 and probably much longer. There are many projections about renewable energy that is supposed to replace fossil fuels over the next few decades. But, look seriously and you can quickly convince yourselves that this is not for real - renewable energy, in due course, might stop the increase in the amounts of fossil fuel we use but it is not practical for them to meet the global energy demand on their own - certainly not by 2050.
And we have left it too late. That global warming is an issue has been known for 50 years or more. Many predictions that science made have come true but governments and business interests have tried their best to confuse the issues. They claimed that no action was needed and no serious action was, therefore, taken. Perversely, the intensity of action needed increases as every day goes by and there are few scientists who believe that global warming may be limited to 3C by 2100 even if nations make their best efforts from now.
Climate change control clashes head-on with Sustainability: Our planet is able to support consumption up to a certain level - we use planetary resources that need to be replenished. This has not been happening. In the OECD countries, we delude ourselves by saying that we have controlled energy consumption - it is not going up. This is dishonest - what we have done is transferred manufacturing to China, India and other developing countries and import finished goods. Emissions from the manufactured goods elsewhere are due to our consumption - they are our emissions and we are not counting them. Include these and OECD will be shown not to be doing so well. Net zero by 2050 as UK and EU claim for their targets will be unachievable.
Who will pay and who will make sacrifices? Rich countries caused the global warming by their extravagant, overconsumption lifestyle over the past 200 years. Even today, USA consumes more than 2 times energy per capita than China and 8 times more than India, and EU is not far behind. Standard of living in OECD will have to come down substantially to reduce emissions - will it happen? Definitely not.
The cost of climate mitigation is enormous - there is no extra money in the kitty. Central banks and poor financial judgements at government level have ensured that most economies are just ticking over - there is no slack and I can't see much enthusiasm for funding climate control measures.
Poor will suffer most, and the rich have the means to do something:
Look at the projections of the area of the world that will be most severely affected by Climate Change. They are the poorest areas just now and have little or no political or economic power to do anything significant. The other group to suffer more will be the poor people in the rich countries - again they will be sidelined by the government policies that will favour the rich (they generally do anyway). Serious migration from poorer countries will happen. The question I would like to ask is whether the poor of the world will be effectively enslaved by the few rich in each country - inequality has been rising and is expected to continue on that trajectory. With new digital technology, a kind of cyber dystopia appears the most probable outcome over the next 80 years or so.
Wednesday, 18 December 2019
Making Sense of our Climate Change: 6. Carbon Isotope Studies Prove That Human are Responsible for Global Warming
Index of Blogs and Courses
Parts 1, 2, 3, 4 and 5 may be accessed here.
This post (Part 6) deals with a couple of complex concepts and may be more challenging.
Parts 1, 2, 3, 4 and 5 may be accessed here.
This post (Part 6) deals with a couple of complex concepts and may be more challenging.
Human activity is responsible for almost all the rise in atmospheric concentration of CO2 since 1990, and hence for the observed global warming. How we can make such a firm statement is the subject of a great scientific detective story. Essentially, from a sample of atmospheric air, we can tell what fraction of CO2 in it originated by burning fossil fuels and how much is due to plant and animal respiration. Amazing!
The slide shows the history of global carbon emissions by burning of fossil fuels. Currently we are sending 10 gigatons of carbon per year into the atmosphere and this is causing an increase in the atmospheric CO2 levels. Because we know how much fuel of each type is being burnt each year, it is possible to give a breakdown of contribution from different fossil fuel types. Coal is the most polluting fuel and the recent sharp increase in its use does not bode well for future carbon emissions.
 Actual measurements of atmospheric CO2 have been carried out at various laboratories since 1958. Historic levels are derived from gases trapped in ice cores in Greenland and Antarctica. These observations suggest that 46% of the CO2 put into the atmosphere by human activity stays in the atmosphere, increasing its concentration. The rest is absorbed by the oceans and terrestrial biosphere.

The remaining CO2 will increase its atmospheric concentration by 2.1 ppm per year. (This can be calculated easily and the method is shown in the slide at the end of this blog).
In this part, I shall describe how we can actually identify the increase in atmospheric CO2 as due to the burning of fossil fuels.
Much of the following discussion is based on the work published by NOAA. I acknowledge Professor Jocelyn Turnbull's help for introducing me to NOAA publications on this subject.
Isotopes of Carbon: Carbon isotope studies can tell us where the atmospheric carbon originated from and the results point unequivocally to fossil fuels as the main source of increased CO2.
There are three isotopes of carbon that are found in nature - all isotopes of an element have the same chemical properties.
C-12 has a mass equal to 12 atomic mass units (1 amu = 1.66 x 10⁻²⁷ kg).
C-13 has a mass equal to 13 amu, and
C-14 (also called radiocarbon) has a mass equal to 14 amu.
C-12 and C-13 are stable, but C-14 is radioactive and decays with a half-life of 5730 years (on decay, C-14 is converted into nitrogen; the amount of C-14 in a sample is reduced by half over 5730 years).
A sample of carbon nominally contains 98.93% C-12 and 1.07% C-13. C-14 makes up about 1 to 1.5 atoms per trillion (1012) carbon atoms. C-14 is being continually produced from N-14 in the atmosphere by cosmic rays at a more or less steady rate that determines its background concentration. The number of C-12 and C-13 atoms remains constant in time.
Different carbon reservoirs 'like' different isotopes; each reservoir contains different proportions of carbon isotopes - has its own isotopic fingerprint. By examining the isotopic mixture in the atmosphere, we can determine how much CO2 is coming from and going to each reservoir.
There are three main carbon reservoir that actively exchange CO2 (see Part 5 about Carbon Cycle).
The terrestrial reservoir consists mainly of plants, animals and soil. Most CO2 is exchanged between the atmosphere and the plants. CO2 diffuses through the stomata of the leaves and then photosynthesised by plants into carbohydrates. Both diffusion and photosynthesis prefer to uptake the lighter mass C-12 atoms in preference to the heavier C-13. Plant material is eaten by animals and also transferred to soil - therefore, carbon in the terrestrial pool is has less C-13 than in the atmosphere. It also has less C-14 incorporated due to the larger mass of C-14.
The top few hundred meters of ocean surface is actively involved in exchanging CO2 with the atmosphere. The lower depths store organic carbon and dissolved CO2 and mix their contents with the upper layers on a much longer timescales of centuries or more. The upper layer of the ocean exchange carbon di-oxide with the atmosphere. Ocean water has no preference for absorbing or outgassing C-12 over C-13. Oceans tend to have similar carbon isotope ratios as the atmosphere.
Fossil fuels are reservoirs which have held prehistoric carbon from millions of years ago. Human activity has brought fossil carbon in play and CO2 generated by burning fossil fuel is sent to the atmosphere in a one-way transaction. When plants and sea creatures got buried millions of years ago, they had some C-14 present. Dead plants do not uptake any fresh carbon. Over the long period since then, C-14 has decayed to almost zero levels (halving in amount every 5730 years) and is present in undetectable amounts in CO2 produced by burning them. Fossil fuels are derived from plants and they also have lower C-13 levels relative to C-12.
Determining Relative Carbon Isotope Values in a Sample:
One uses an isotope mass spectrometer (MS) or an accelerated mass spectrometer (AMS) for determing C-13/C-12 or C-14/C-12 concentration ratios. Spectrometers are good at telling us relative values but not so accurate for absolute values; and one makes a simultaneous measurement with a standard where the ratios are known accurately. Comparison with the standard provides absolute isotopic ratios for the sample - these are expressed as delta values - as explained in the slide below.
(The slide may be skipped without loss of continuity)

An Example: We can now show how the ∆ value of the atmosphere will change by injection of CO2 produced by burning fossil fuels. Suppose the CO2 level is 400 ppm and in a year there is net injection of 2.5 ppm CO2 from fossil fuels. This will change the ∆ value of the atmosphere to 38.5‰ from 45‰. From this example, we expect that ∆ (C-14) value will decrease by about 2.6% for every 1 ppm CO2 added to the atmosphere by burning fossil fuels.
Actual Measurements: CO2 takes about one year to fully mix in the atmosphere with other gases. In order to study the change in C-14 levels in the atmosphere, it is best to find a region where there is no local hot-spot of burning fossil fuels. In a well isolated region, away from populated areas we can monitor ∆ (C-14) values over a period of time and study any changes taking place - the changes will indicate the role of fossil fuels in the changing concentration of CO2.
The next slide shows the change in ∆ (C-14) values in an isolated region of the Rocky Mountains in Colorado:
 If we make such measurements near a local industrial area then CO2 produced would not have time to mix in the atmosphere and measured ∆ (C-14) values will be lower than those obtained for an isolated region. This is shown in the next slide:

The above discussion shows that we can not only prove conclusively that majority of the added CO2 in the atmocphere is due to human activity of burning fossil fuels but we can also determine the exact amount of the added CO2 from fossil fuels.
δ(C-13) Values: We can also measure changes in δ(C-13) values that can be measured with very high precision with a mass spectrometer. Fossil fuels have a δ(C-13) of -28 ‰ while the atmosphere δ(C-13) = -8 ‰. Therefore, carbon di-oxide produced by burning fossil fuels will reduce the δ(C-13) value of atmospheric CO2. However, the terrestrial biosphere also exchanges CO2 with the atmosphere and will also decrease the δ(C-13) value. The analysis is more complex but we can separate the contribution of different sources by studying changes in δ(C-13). This discussion is outside the scope of this blog and I refer you to NOAA publication for a more detailed discussion.
*************************************
*************************************
 *************************************************************************
The slide shows the history of global carbon emissions by burning of fossil fuels. Currently we are sending 10 gigatons of carbon per year into the atmosphere and this is causing an increase in the atmospheric CO2 levels. Because we know how much fuel of each type is being burnt each year, it is possible to give a breakdown of contribution from different fossil fuel types. Coal is the most polluting fuel and the recent sharp increase in its use does not bode well for future carbon emissions.


The remaining CO2 will increase its atmospheric concentration by 2.1 ppm per year. (This can be calculated easily and the method is shown in the slide at the end of this blog).
In this part, I shall describe how we can actually identify the increase in atmospheric CO2 as due to the burning of fossil fuels.
Much of the following discussion is based on the work published by NOAA. I acknowledge Professor Jocelyn Turnbull's help for introducing me to NOAA publications on this subject.
Isotopes of Carbon: Carbon isotope studies can tell us where the atmospheric carbon originated from and the results point unequivocally to fossil fuels as the main source of increased CO2.
There are three isotopes of carbon that are found in nature - all isotopes of an element have the same chemical properties.
C-12 has a mass equal to 12 atomic mass units (1 amu = 1.66 x 10⁻²⁷ kg).
C-13 has a mass equal to 13 amu, and
C-14 (also called radiocarbon) has a mass equal to 14 amu.
C-12 and C-13 are stable, but C-14 is radioactive and decays with a half-life of 5730 years (on decay, C-14 is converted into nitrogen; the amount of C-14 in a sample is reduced by half over 5730 years).
A sample of carbon nominally contains 98.93% C-12 and 1.07% C-13. C-14 makes up about 1 to 1.5 atoms per trillion (1012) carbon atoms. C-14 is being continually produced from N-14 in the atmosphere by cosmic rays at a more or less steady rate that determines its background concentration. The number of C-12 and C-13 atoms remains constant in time.
Different carbon reservoirs 'like' different isotopes; each reservoir contains different proportions of carbon isotopes - has its own isotopic fingerprint. By examining the isotopic mixture in the atmosphere, we can determine how much CO2 is coming from and going to each reservoir.
There are three main carbon reservoir that actively exchange CO2 (see Part 5 about Carbon Cycle).
The terrestrial reservoir consists mainly of plants, animals and soil. Most CO2 is exchanged between the atmosphere and the plants. CO2 diffuses through the stomata of the leaves and then photosynthesised by plants into carbohydrates. Both diffusion and photosynthesis prefer to uptake the lighter mass C-12 atoms in preference to the heavier C-13. Plant material is eaten by animals and also transferred to soil - therefore, carbon in the terrestrial pool is has less C-13 than in the atmosphere. It also has less C-14 incorporated due to the larger mass of C-14.
The top few hundred meters of ocean surface is actively involved in exchanging CO2 with the atmosphere. The lower depths store organic carbon and dissolved CO2 and mix their contents with the upper layers on a much longer timescales of centuries or more. The upper layer of the ocean exchange carbon di-oxide with the atmosphere. Ocean water has no preference for absorbing or outgassing C-12 over C-13. Oceans tend to have similar carbon isotope ratios as the atmosphere.
Fossil fuels are reservoirs which have held prehistoric carbon from millions of years ago. Human activity has brought fossil carbon in play and CO2 generated by burning fossil fuel is sent to the atmosphere in a one-way transaction. When plants and sea creatures got buried millions of years ago, they had some C-14 present. Dead plants do not uptake any fresh carbon. Over the long period since then, C-14 has decayed to almost zero levels (halving in amount every 5730 years) and is present in undetectable amounts in CO2 produced by burning them. Fossil fuels are derived from plants and they also have lower C-13 levels relative to C-12.
Determining Relative Carbon Isotope Values in a Sample:
One uses an isotope mass spectrometer (MS) or an accelerated mass spectrometer (AMS) for determing C-13/C-12 or C-14/C-12 concentration ratios. Spectrometers are good at telling us relative values but not so accurate for absolute values; and one makes a simultaneous measurement with a standard where the ratios are known accurately. Comparison with the standard provides absolute isotopic ratios for the sample - these are expressed as delta values - as explained in the slide below.
(The slide may be skipped without loss of continuity)

An Example: We can now show how the ∆ value of the atmosphere will change by injection of CO2 produced by burning fossil fuels. Suppose the CO2 level is 400 ppm and in a year there is net injection of 2.5 ppm CO2 from fossil fuels. This will change the ∆ value of the atmosphere to 38.5‰ from 45‰. From this example, we expect that ∆ (C-14) value will decrease by about 2.6% for every 1 ppm CO2 added to the atmosphere by burning fossil fuels.
Actual Measurements: CO2 takes about one year to fully mix in the atmosphere with other gases. In order to study the change in C-14 levels in the atmosphere, it is best to find a region where there is no local hot-spot of burning fossil fuels. In a well isolated region, away from populated areas we can monitor ∆ (C-14) values over a period of time and study any changes taking place - the changes will indicate the role of fossil fuels in the changing concentration of CO2.
The next slide shows the change in ∆ (C-14) values in an isolated region of the Rocky Mountains in Colorado:


The above discussion shows that we can not only prove conclusively that majority of the added CO2 in the atmocphere is due to human activity of burning fossil fuels but we can also determine the exact amount of the added CO2 from fossil fuels.
δ(C-13) Values: We can also measure changes in δ(C-13) values that can be measured with very high precision with a mass spectrometer. Fossil fuels have a δ(C-13) of -28 ‰ while the atmosphere δ(C-13) = -8 ‰. Therefore, carbon di-oxide produced by burning fossil fuels will reduce the δ(C-13) value of atmospheric CO2. However, the terrestrial biosphere also exchanges CO2 with the atmosphere and will also decrease the δ(C-13) value. The analysis is more complex but we can separate the contribution of different sources by studying changes in δ(C-13). This discussion is outside the scope of this blog and I refer you to NOAA publication for a more detailed discussion.
*************************************
*************************************

Saturday, 14 December 2019
Making Sense of our Climate Change: 5. Carbon Cycle and the Keeling Curve
Index of Blogs and Courses
Parts 1, 2, 3, 4 and 6 may be accessed here.
Until the industrial revolution 200 years ago, the balance of carbon was largely determined by natural processes. At a level of about 280 ppm, atmospheric carbon di-oxide was in equilibrium with the rest of the carbon in the ecosystem. A strong volcanic eruption or higher number of forest fires might disturb the equilibrium for a short while but things were fairly stable. In the past 200 years, human activity has not only changed the land profile through deforestation and extensive farming, but humans have been burning fossil fuels that converts historic carbon ( coal, petroleum and natural gas buried underground millions of years ago) into CO2 and releases it into the atmosphere.
The increased concentration of CO2 in the atmosphere results in other parts of the ecosystem absorbing more CO2 to reach a balance between atmospheric and land & oceanic carbon di-oxide. However, only half of the CO2 sent to the atmosphere by human activity is removed by rebalancing the carbon cycle - the other half mixes with atmospheric gases and results in an overall increase of long term CO2 concentration in the atmosphere. This value has gone up from 280 ppm in year 1800 to 410+ ppm in 2019. The inevitable global warming effect has been observed to have warmed the land mass of the Earth on average by 1.1C; the sea surface temperature has risen by about 0.13C per decade over the past 100 years.
The exchange of carbon among different components of the ecosystem is described by the Carbon Cycle. Oceans and soils hold the major fraction of carbon at the Earth's surface - in the form of dissolved CO2 in the oceans and organic carbon in the soil. Carbon inventory of the oceans is sensitive to the surface water temperature - CO2 is less soluble in warmer waters (solubility decreases by about 3% per degree centigrade rise in temperature) and may reduce the ability of oceans to remove CO2 in future. Deforestation and land clearance increase loss of carbon from the land. The two slides show a highly simplified view of the carbon cycle. - (Click here for a more detailed description)

The slide provides a good summary of carbon exchange in the ecosystem. Most exchange happens through CO2 in the atmosphere.

Notice that the largest store of carbon is in the form of carbonate sedimentary rocks made up primarily from buried dead coral and shells of sea-creatures. They are mostly carbonates of calcium and magnesium. During cement manufacturing, calcium carbonate is heated and CO2 is released to the atmosphere - this provides an additional important contribution.
In slide 2, the numbers in red give the rate of carbon release in gigatons per year (GTC/y). For comparison, volcanic activity, on average, puts 0.1 GTC/y CO2 into the atmosphere. The major recent addition is the burning of fossil fuels by humans at 10 GTC/y.
 The box on the right (Click on the box to expand) explains the confusing use of carbon and CO2
interchangeably. Because carbon is in many different forms in various inventories, it is more convenient to talk of carbon amount than of CO2.
The Keeling Curve: In 1958, Charles Keeling (1928 - 2005) started measuring CO2 concentration in the atmosphere at the Mauna Loa Observatory (Hawaii). Keeling curve provides a record of the progressive build-up of atmospheric CO2. Keeling first alerted the world of human activity driven greenhouse effect and global warming.
The slide shows the Keeling curve as of 2019. Notice the ability of the measurements to pick up the variation of CO2 levels during the year. In Northern hemisphere, plants use CO2 during the growth period from April to October and respire CO2 during the winter months. This shows up as an oscillatory signature superimposed on the annual trend of atmospheric CO2 concentration. The slide is adapted from Data from Dr. Pieter Tans, NOAA/ESRL and Dr. Ralph Keeling, Scripps Institution of Oceanography.
 An important observation from the Keeling Curve is the change in slope of the curve from around 1995. The rise in CO2 concentration is more steep and it is going up at a faster rate now than previously. This is worrying as this represents that global warming may have quickened. The increasing slope simply reflects the situation on the ground where human activity is burning greater amounts of fossil fuels and enhancing atmospheric CO2 levels.
In Part 6, I shall explain how we can determine the contribution of human activity to the increasing amount of CO2 in the atmosphere. In fact, as we shall see, almost all the increase in CO2 levels may be credited to human activity with natural variations playing an insignificant role.
Parts 1, 2, 3, 4 and 6 may be accessed here.
Until the industrial revolution 200 years ago, the balance of carbon was largely determined by natural processes. At a level of about 280 ppm, atmospheric carbon di-oxide was in equilibrium with the rest of the carbon in the ecosystem. A strong volcanic eruption or higher number of forest fires might disturb the equilibrium for a short while but things were fairly stable. In the past 200 years, human activity has not only changed the land profile through deforestation and extensive farming, but humans have been burning fossil fuels that converts historic carbon ( coal, petroleum and natural gas buried underground millions of years ago) into CO2 and releases it into the atmosphere.
The increased concentration of CO2 in the atmosphere results in other parts of the ecosystem absorbing more CO2 to reach a balance between atmospheric and land & oceanic carbon di-oxide. However, only half of the CO2 sent to the atmosphere by human activity is removed by rebalancing the carbon cycle - the other half mixes with atmospheric gases and results in an overall increase of long term CO2 concentration in the atmosphere. This value has gone up from 280 ppm in year 1800 to 410+ ppm in 2019. The inevitable global warming effect has been observed to have warmed the land mass of the Earth on average by 1.1C; the sea surface temperature has risen by about 0.13C per decade over the past 100 years.
The exchange of carbon among different components of the ecosystem is described by the Carbon Cycle. Oceans and soils hold the major fraction of carbon at the Earth's surface - in the form of dissolved CO2 in the oceans and organic carbon in the soil. Carbon inventory of the oceans is sensitive to the surface water temperature - CO2 is less soluble in warmer waters (solubility decreases by about 3% per degree centigrade rise in temperature) and may reduce the ability of oceans to remove CO2 in future. Deforestation and land clearance increase loss of carbon from the land. The two slides show a highly simplified view of the carbon cycle. - (Click here for a more detailed description)

The slide provides a good summary of carbon exchange in the ecosystem. Most exchange happens through CO2 in the atmosphere.
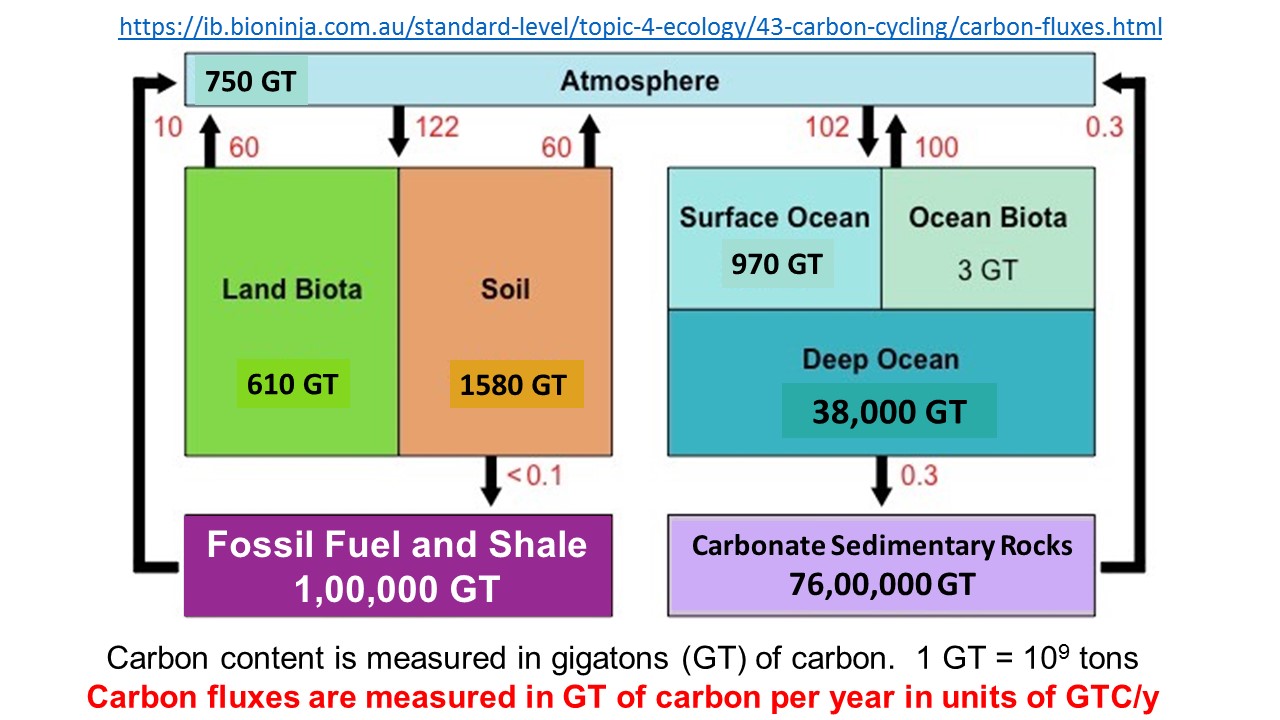
Notice that the largest store of carbon is in the form of carbonate sedimentary rocks made up primarily from buried dead coral and shells of sea-creatures. They are mostly carbonates of calcium and magnesium. During cement manufacturing, calcium carbonate is heated and CO2 is released to the atmosphere - this provides an additional important contribution.
In slide 2, the numbers in red give the rate of carbon release in gigatons per year (GTC/y). For comparison, volcanic activity, on average, puts 0.1 GTC/y CO2 into the atmosphere. The major recent addition is the burning of fossil fuels by humans at 10 GTC/y.
 The box on the right (Click on the box to expand) explains the confusing use of carbon and CO2
 interchangeably. Because carbon is in many different forms in various inventories, it is more convenient to talk of carbon amount than of CO2.
The Keeling Curve: In 1958, Charles Keeling (1928 - 2005) started measuring CO2 concentration in the atmosphere at the Mauna Loa Observatory (Hawaii). Keeling curve provides a record of the progressive build-up of atmospheric CO2. Keeling first alerted the world of human activity driven greenhouse effect and global warming.
The slide shows the Keeling curve as of 2019. Notice the ability of the measurements to pick up the variation of CO2 levels during the year. In Northern hemisphere, plants use CO2 during the growth period from April to October and respire CO2 during the winter months. This shows up as an oscillatory signature superimposed on the annual trend of atmospheric CO2 concentration. The slide is adapted from Data from Dr. Pieter Tans, NOAA/ESRL and Dr. Ralph Keeling, Scripps Institution of Oceanography.

In Part 6, I shall explain how we can determine the contribution of human activity to the increasing amount of CO2 in the atmosphere. In fact, as we shall see, almost all the increase in CO2 levels may be credited to human activity with natural variations playing an insignificant role.
Tuesday, 10 December 2019
Making Sense of our Climate Change: 4. Global Warming Indicators
Index of Blogs and Courses
Parts 1, 2 and 3 may be accessed here.
In Part 3, I had discussed how greenhouse gases (GHGs) trap and send back some of the heat energy radiated from the earth. The result is a warming of the earth's temperature. In this part we shall look at some of our planet's vital signs that are affected and may even be used to quantify the warming.
Concentration of GHGs in the earth's atmosphere has been increasing for the past 200 years resulting in a corresponding rise of earth's temperature. This is widely attributed to the much enhanced human activity since the first industrial revolution - for example, the phenomenal rise in the use of fossil fuels to power the manufacturing industries, internal combustion based road and air transport and mechanisation in agricultural (I shall discuss how we empirically identify human involvement/contribution in global warming in Part 6).
Earth's temperature can also change due to natural causes such as variations in earth's orbit around the Sun affecting the amount of solar energy reaching the earth. These variations, called the Melankovich Cycles have long time periods and have regularly affected earth's climate in the past. Another natural cause might be changes in Solar energy output or changes in cosmic rays intensity. Scientific studies have ruled out the possibility (as some claim) that changes in earth's climate since the year 1800 are wholly due to such natural variations; and have strongly (and convincingly) implicated human activity to be the major driving force behind recent global warming.
Following three slides show the data:
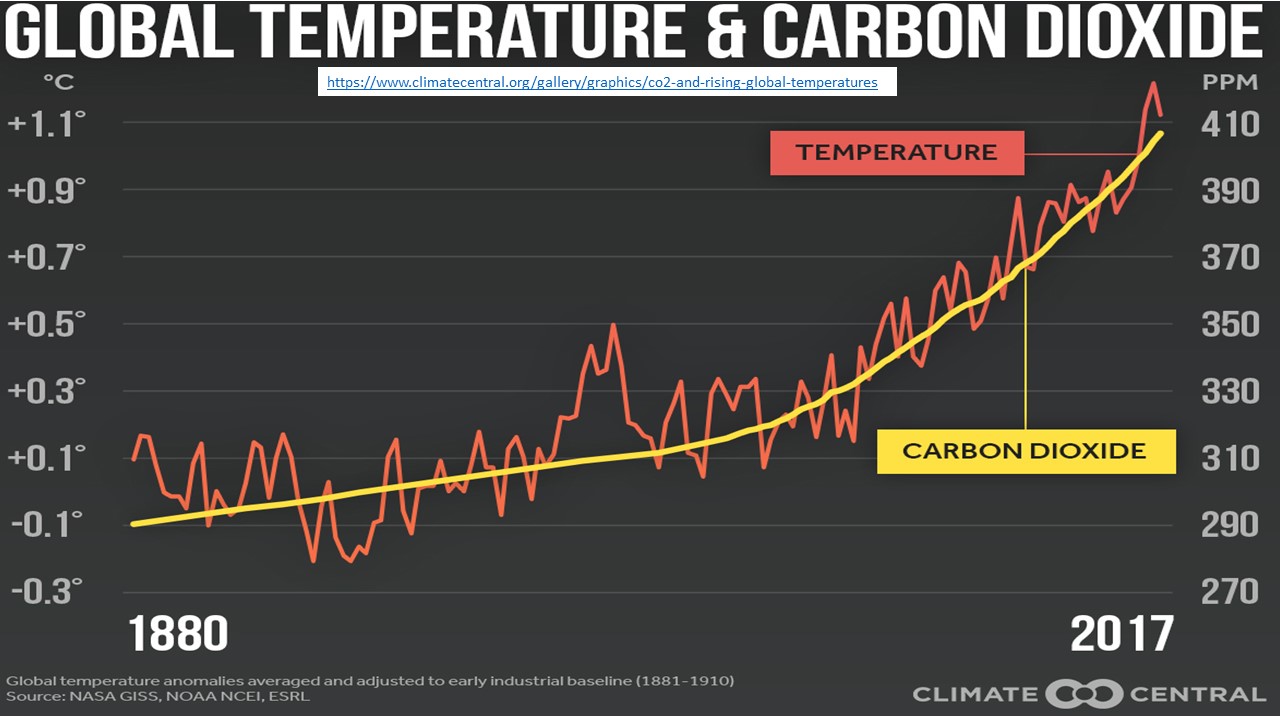
 The figure clearly establishes that temperature and atmospheric CO2 levels are highly correlated. Also note that over the past 800,000 years, CO2 levels have been below 290 parts per million. However, in the past 200 years CO2 concentration has shot up to 410+ ppm as the next two slides demonstrate.

The concentration of other greenhouse gases has also increased - the figure below shows an exponential increase (red panel) since the industrial revolution when both the human population and industrial activity burning fossil fuels really took off.

A credible model of what has been happening is described below:
The use of fossil fuels (coal, oil and natural gas) mainly releases carbon dioxide (CO2) into the atmosphere where it resides for a period of 200 years or more. Some 50% CO2 is absorbed by the oceans and land plants, while the rest half mixes with the gases in the atmosphere. Increased atmospheric CO2 concentrations return a larger fraction of earth's IR radiation back to the earth to be absorbed mostly by the oceans - oceans become a sink for this extra heat energy - and cause warming of its surface temperature. The extra thermal energy is distributed throughout the globe by air circulation currents - increasing the land and atmospheric temperatures also. The result is a general increase in global heat content and its temperature.
Besides burning fossil fuels, many human activities like deforestation, excessive use of nitrogen based fertilisers etc. are causing loss of forests, soil erosion, environmental pollution, habitat & bio-diversity loss and much more. In tandem with climate change, the result of these human activities have serious deleterious effects on life on earth.
I mention some of the indicators below
Global Warming leads to the melting of ice in the cryosphere - mountain glaciers melt faster, ice cover in the Arctic and Antarctica is reduced. Mountain glaciers supply freshwater to almost 2 billion people - their disappearance will be catastrophic for the supply of drinking water and for irrigation to the communities affected.
The sea water volume expands due to increased temperatures. Also additional water is added to the oceans by melting ice sheets and glaciers. Greenland ice is melting seven times faster than it was 25 years ago and is equivalent to a sea-level rise of 7 mm/decade. The sea-level increase threatens to inundate coastal cities where large populations live.
The sea at a higher temperature holds more energy and engenders more powerful hurricanes.
Wind patters are affected causing variations in rainfall and drought patterns throughout the globe.
Higher land temperatures evaporate more water from the land and trees in forests, making the wood drier. This enhances the frequency and severity of wild fires.
Absorbed CO2 in the oceans makes them more acidic leading to a decline in coral health and other sea-life.
Animal habitats are affected. Many animal species move to the colder temperatures at higher latitudes because their traditional habitats have become too hot.
Insects can now survive in many northern regions that were too cold for them in the past. Many of the tropical diseases borne by these insects are beginning to spread to new regions - people in these regions have little or no immunity to such diseases.
Species living in year-round icy conditions have no where to migrate to and will eventually become extinct.
It is concerning to note that all of these expectations (I have not listed all of them here) have transpired and the data available points to global warming as the underlying cause. Ironically, over the past few decades, most data indicates globe warming is increasing at a faster rate - the situation is getting worse - and many scientists are very worried about the future catastrophes that out of control global warming might deliver to the human civilisation and even cause much irreversible damage. Concerned scientists and international bodies have been putting out warnings about the urgent need to control and reverse climate change.
I end this part with some graphs showing the most important trend. Human population is the driving force behind increased consumption and is the most important parameter whose trend is strongly upwards. The global population has to come down for the global warming and climate change to be reversed. There are few sign of this happening as the next two slides show:


By UN projections, the annual growth rate will decrease from the peak of 2.1% in 1950 to 0.1% in 2100. This is still an increase. The exponential growth, even for this minuscule looking number, will double the population to 22 billion in year 2800 and to 44 billion in year 3500. The population pyramid shown in the second slide is unnerving when one realises the age structure in year 2100 compared to 2018. While there will be some increase of population in 0 to 35 age group, most numbers will be added to the older ageing population above 60 years. There will be about 800 million people of age 80+ years. How this will be managed is anybody's guess - certainly world leaders do not ever talk about these matters - it is a problem of the future - that is the tragedy of sustainable development.
Along with human population, the number of the ruminant livestock (raised for their meat) has been increasing by almost 1% per year over the past 50 years; per capita meat consumption also increasing by this amount. These animals require a lot of water, land, food and energy resources, and these have been increasing accordingly. For example, Amazon rain-forest is being lost at 2.4% per year (to grow animal-feed and corn for bio-fuels) and the global tree cover loss (to create new farming land) has been a staggering 5% per year since the year 2000. Forests are one of the most efficient sinks of CO2 - their loss translates into less CO2 absorbed from the atmosphere and hence more global warming. Accelerated global warming is exactly what we have been observing over the past decades.
The world business model is that of perpetual growth. In absence of growth, the global monetary system will come crashing down and growth must be maintained at all costs. Growth means higher energy consumption that in turn means higher GHG emissions leading to increased global warming. It is a vicious cycle and some miraculous leap of technology is required to break it. None is on the horizon and there is not much time left to act decisively.
In Part 5, I shall discuss the Carbon Cycle, and in Part 6 we shall look at the evidence that most of the recent global warming is caused by human activity. The evidence is based on radiocarbon studies and we shall look at the science of radiocarbon and stable isotope analysis of climate indicators.
Parts 1, 2 and 3 may be accessed here.
Scientific evidence for warming of the climate system is unequivocal.
- Intergovernmental Panel on Climate Change (IPCC)
In Part 3, I had discussed how greenhouse gases (GHGs) trap and send back some of the heat energy radiated from the earth. The result is a warming of the earth's temperature. In this part we shall look at some of our planet's vital signs that are affected and may even be used to quantify the warming.
Concentration of GHGs in the earth's atmosphere has been increasing for the past 200 years resulting in a corresponding rise of earth's temperature. This is widely attributed to the much enhanced human activity since the first industrial revolution - for example, the phenomenal rise in the use of fossil fuels to power the manufacturing industries, internal combustion based road and air transport and mechanisation in agricultural (I shall discuss how we empirically identify human involvement/contribution in global warming in Part 6).
Earth's temperature can also change due to natural causes such as variations in earth's orbit around the Sun affecting the amount of solar energy reaching the earth. These variations, called the Melankovich Cycles have long time periods and have regularly affected earth's climate in the past. Another natural cause might be changes in Solar energy output or changes in cosmic rays intensity. Scientific studies have ruled out the possibility (as some claim) that changes in earth's climate since the year 1800 are wholly due to such natural variations; and have strongly (and convincingly) implicated human activity to be the major driving force behind recent global warming.
Following three slides show the data:

The concentration of other greenhouse gases has also increased - the figure below shows an exponential increase (red panel) since the industrial revolution when both the human population and industrial activity burning fossil fuels really took off.

A credible model of what has been happening is described below:
The use of fossil fuels (coal, oil and natural gas) mainly releases carbon dioxide (CO2) into the atmosphere where it resides for a period of 200 years or more. Some 50% CO2 is absorbed by the oceans and land plants, while the rest half mixes with the gases in the atmosphere. Increased atmospheric CO2 concentrations return a larger fraction of earth's IR radiation back to the earth to be absorbed mostly by the oceans - oceans become a sink for this extra heat energy - and cause warming of its surface temperature. The extra thermal energy is distributed throughout the globe by air circulation currents - increasing the land and atmospheric temperatures also. The result is a general increase in global heat content and its temperature.
Besides burning fossil fuels, many human activities like deforestation, excessive use of nitrogen based fertilisers etc. are causing loss of forests, soil erosion, environmental pollution, habitat & bio-diversity loss and much more. In tandem with climate change, the result of these human activities have serious deleterious effects on life on earth.
How Global Warming Affects Things on the Ground?
What are the Indicators?
I mention some of the indicators below
Global Warming leads to the melting of ice in the cryosphere - mountain glaciers melt faster, ice cover in the Arctic and Antarctica is reduced. Mountain glaciers supply freshwater to almost 2 billion people - their disappearance will be catastrophic for the supply of drinking water and for irrigation to the communities affected.
The sea water volume expands due to increased temperatures. Also additional water is added to the oceans by melting ice sheets and glaciers. Greenland ice is melting seven times faster than it was 25 years ago and is equivalent to a sea-level rise of 7 mm/decade. The sea-level increase threatens to inundate coastal cities where large populations live.
The sea at a higher temperature holds more energy and engenders more powerful hurricanes.
Wind patters are affected causing variations in rainfall and drought patterns throughout the globe.
Higher land temperatures evaporate more water from the land and trees in forests, making the wood drier. This enhances the frequency and severity of wild fires.
Absorbed CO2 in the oceans makes them more acidic leading to a decline in coral health and other sea-life.
Animal habitats are affected. Many animal species move to the colder temperatures at higher latitudes because their traditional habitats have become too hot.
Insects can now survive in many northern regions that were too cold for them in the past. Many of the tropical diseases borne by these insects are beginning to spread to new regions - people in these regions have little or no immunity to such diseases.
Species living in year-round icy conditions have no where to migrate to and will eventually become extinct.
It is concerning to note that all of these expectations (I have not listed all of them here) have transpired and the data available points to global warming as the underlying cause. Ironically, over the past few decades, most data indicates globe warming is increasing at a faster rate - the situation is getting worse - and many scientists are very worried about the future catastrophes that out of control global warming might deliver to the human civilisation and even cause much irreversible damage. Concerned scientists and international bodies have been putting out warnings about the urgent need to control and reverse climate change.
I end this part with some graphs showing the most important trend. Human population is the driving force behind increased consumption and is the most important parameter whose trend is strongly upwards. The global population has to come down for the global warming and climate change to be reversed. There are few sign of this happening as the next two slides show:


By UN projections, the annual growth rate will decrease from the peak of 2.1% in 1950 to 0.1% in 2100. This is still an increase. The exponential growth, even for this minuscule looking number, will double the population to 22 billion in year 2800 and to 44 billion in year 3500. The population pyramid shown in the second slide is unnerving when one realises the age structure in year 2100 compared to 2018. While there will be some increase of population in 0 to 35 age group, most numbers will be added to the older ageing population above 60 years. There will be about 800 million people of age 80+ years. How this will be managed is anybody's guess - certainly world leaders do not ever talk about these matters - it is a problem of the future - that is the tragedy of sustainable development.
Along with human population, the number of the ruminant livestock (raised for their meat) has been increasing by almost 1% per year over the past 50 years; per capita meat consumption also increasing by this amount. These animals require a lot of water, land, food and energy resources, and these have been increasing accordingly. For example, Amazon rain-forest is being lost at 2.4% per year (to grow animal-feed and corn for bio-fuels) and the global tree cover loss (to create new farming land) has been a staggering 5% per year since the year 2000. Forests are one of the most efficient sinks of CO2 - their loss translates into less CO2 absorbed from the atmosphere and hence more global warming. Accelerated global warming is exactly what we have been observing over the past decades.
The world business model is that of perpetual growth. In absence of growth, the global monetary system will come crashing down and growth must be maintained at all costs. Growth means higher energy consumption that in turn means higher GHG emissions leading to increased global warming. It is a vicious cycle and some miraculous leap of technology is required to break it. None is on the horizon and there is not much time left to act decisively.
In Part 5, I shall discuss the Carbon Cycle, and in Part 6 we shall look at the evidence that most of the recent global warming is caused by human activity. The evidence is based on radiocarbon studies and we shall look at the science of radiocarbon and stable isotope analysis of climate indicators.
Monday, 2 December 2019
Isaac Newton_Troubled Genius: 1. Family Tree; Early Years
Index of Blogs and Courses
Isaac Newton has been repeatedly voted as the most brilliant scientist ever. Newton's achievements in physics (natural philosophy as it was known then), mathematics and astronomy set the stage for the next 300 years and continue to be the starting point in scientific education; much of current research and engineering still operates on the laws he enunciated.
As Master of the Mint for 22 years, Newton rescued the British currency from fraudsters and saved it from collapsing. Newton had an all-consuming interest in the old practice of alchemy and devoted untold number of hours in the pursuit of finding the secret of making gold from ordinary metals.
Born in an Anglican family and strongly influenced by Christianity, Newton held his own special views about God and His role in the world. Newton believed that God's existence could not be denied in the face of the grandeur of all creation - God was the masterful Creator. “Gravity explains the motion of the planets, but it cannot explain who sets the planets in motion.”
His investigations in the structure and rules governing the natural world challenged established religion. His genius and reasoning, that produced extraordinary insights into the formulation and understanding of the laws of science, were brilliantly utilised in his analysis of Christianity. He formed his own beliefs based on his studies of the Bible - needless to say that he rejected many of the biblical doctrines. His views on religion did not conform with accepted beliefs, and would have been considered formally heretical by the Church of England. Newton, quite wisely, did not publish his theological studies.
His written manuscripts, mostly unpublished, stretch to 10 million words (more than 20,000 pages) of which 5 million are devoted to religion and 1 million on alchemy. Only 30% of his writing relate to science and mathematics.
Newton as a person is depicted as someone who was arrogant, vindictive, secretive and insecure - he was obsessed with power and reputation. He just could not tolerate any criticism and made life-long enemies with those who crossed his path. Newton twice suffered nervous breakdown suspecting his friends were conspiring against him. In 1679, Newton started a life of solitude and isolation for six years following some criticism of his work by fellow scientists.
He never married and there are no credible records of any romantic episodes. His father died three months before he was born, and when Newton was three years old his mother left him with his grandmother to live with her new husband. Newton's hatred for his stepfather is well documented, he even threatened to burn his house down. His troubled childhood prepared Newton for obsessive devotion to whatever projects he had at hand. Reluctant to publish his work, Newton developed his observations and theories about nature single-handed with no scientific collaborators.
_________________________
You might be interested in
Family Tree and Early Life: Isaac Newton's ancestors were yeoman farmers. Yeoman farmers in England owned enough land to support a comfortable lifestyle, they farmed it themselves, and because they worked for a living, yeomen were classed below landed gentry. Isaac Newton's father married Hannah Ayscough in April 1642, but passed away after 6 months in October. Isaac Newton was born prematurely and was a tiny baby who miraculously survived. (The slide at the end of this blog describes the confusion created by the use of two different calendars)

In 1646, Newton's mother (age 23) married Reverend Barnabas Smith (age 64) with whom she had three children. Young Isaac was cared for by his maternal grandmother Margery for the next eight years. Abandoned by his mother and living in relative isolation in a farmhouse, Newton developed the characteristics of self-sufficiency and secrecy that he displayed vividly in later life.

Barnabas Smith died in 1653 and Newton's mother Hannah Smith returned to the family home at Woolsthorpe with her three children. In his will, Barnabas Smith had left Newton 200 books, largely theological in content and it is likely that having read whatever was available, Newton had acquired extensive knowledge about Christianity.
In 1656, Newton was sent to the King's College, a grammar school in Grantham. His mother wanted Newton to look after the farm but was convinced by his uncle and others to let Isaac continue his education in Grantham and prepare for entry to Cambridge University. Though not an outstanding student at school, Newton read extensively and impressed those around him. Acquired good proficiency in Latin and Greek at school. He was great in making mechanical devices which were greatly admired for their detail and precision.
In July 1661, Newton was admitted to Trinity College, Cambridge University and remained there for the next 35 years. The university in the seventeenth century was primarily a religious institution, its curriculum bogged down in the Middle Ages with Aristotle's work forming a major part. Earth was at the centre of the Universe - Copernican theories had no place in the university. Newton wrote about his lessons: 'Good friends are Aristotle and Plato, but a greater friend is truth'.
In 1663, Newton met John Wickins, a like minded student. They did not fit in the cultural environment of the university, became room-mates for the next twenty years. Wickins acted as his assistant and amanuensis (scribe). Newton largely ignored the official university curriculum of classics, Euclidean geometry (Newton found it too simple) and Aristotelian philosophy (largely discredited by Newton's time). Instead Newton wrote down a list of about 72 topics for his investigations - both experimentally and theoretically - 'Certain Philosophical Questions'.
Newton graduated with a BA in 1665 and returned to Woolsthorpe where he got trapped for two years by the raging plague affecting Cambridge.
We shall look at the scientific/professional life and latter years of Isaac Newton in Part 2...
Just When Did Newton Die?

A more detailed biography of Sir Isaac Newton may be accessed here
Life and Work of Sir Isaac Newton: Course at CLL, Strathclyde University, Scotland (October 2021)
Isaac Newton has been repeatedly voted as the most brilliant scientist ever. Newton's achievements in physics (natural philosophy as it was known then), mathematics and astronomy set the stage for the next 300 years and continue to be the starting point in scientific education; much of current research and engineering still operates on the laws he enunciated.
As Master of the Mint for 22 years, Newton rescued the British currency from fraudsters and saved it from collapsing. Newton had an all-consuming interest in the old practice of alchemy and devoted untold number of hours in the pursuit of finding the secret of making gold from ordinary metals.
Born in an Anglican family and strongly influenced by Christianity, Newton held his own special views about God and His role in the world. Newton believed that God's existence could not be denied in the face of the grandeur of all creation - God was the masterful Creator. “Gravity explains the motion of the planets, but it cannot explain who sets the planets in motion.”
His investigations in the structure and rules governing the natural world challenged established religion. His genius and reasoning, that produced extraordinary insights into the formulation and understanding of the laws of science, were brilliantly utilised in his analysis of Christianity. He formed his own beliefs based on his studies of the Bible - needless to say that he rejected many of the biblical doctrines. His views on religion did not conform with accepted beliefs, and would have been considered formally heretical by the Church of England. Newton, quite wisely, did not publish his theological studies.
His written manuscripts, mostly unpublished, stretch to 10 million words (more than 20,000 pages) of which 5 million are devoted to religion and 1 million on alchemy. Only 30% of his writing relate to science and mathematics.
Newton as a person is depicted as someone who was arrogant, vindictive, secretive and insecure - he was obsessed with power and reputation. He just could not tolerate any criticism and made life-long enemies with those who crossed his path. Newton twice suffered nervous breakdown suspecting his friends were conspiring against him. In 1679, Newton started a life of solitude and isolation for six years following some criticism of his work by fellow scientists.
He never married and there are no credible records of any romantic episodes. His father died three months before he was born, and when Newton was three years old his mother left him with his grandmother to live with her new husband. Newton's hatred for his stepfather is well documented, he even threatened to burn his house down. His troubled childhood prepared Newton for obsessive devotion to whatever projects he had at hand. Reluctant to publish his work, Newton developed his observations and theories about nature single-handed with no scientific collaborators.
_________________________
You might be interested in
Special Theory of Relativity (Part 1) & (Part 2): An Outreach Series
General Theory of Relativity (Part 1) & (Part 2): An Outreach Series
______________________________________________________
Family Tree and Early Life: Isaac Newton's ancestors were yeoman farmers. Yeoman farmers in England owned enough land to support a comfortable lifestyle, they farmed it themselves, and because they worked for a living, yeomen were classed below landed gentry. Isaac Newton's father married Hannah Ayscough in April 1642, but passed away after 6 months in October. Isaac Newton was born prematurely and was a tiny baby who miraculously survived. (The slide at the end of this blog describes the confusion created by the use of two different calendars)

In 1646, Newton's mother (age 23) married Reverend Barnabas Smith (age 64) with whom she had three children. Young Isaac was cared for by his maternal grandmother Margery for the next eight years. Abandoned by his mother and living in relative isolation in a farmhouse, Newton developed the characteristics of self-sufficiency and secrecy that he displayed vividly in later life.
Sir Isaac Newton's Family Tree

Barnabas Smith died in 1653 and Newton's mother Hannah Smith returned to the family home at Woolsthorpe with her three children. In his will, Barnabas Smith had left Newton 200 books, largely theological in content and it is likely that having read whatever was available, Newton had acquired extensive knowledge about Christianity.
In 1656, Newton was sent to the King's College, a grammar school in Grantham. His mother wanted Newton to look after the farm but was convinced by his uncle and others to let Isaac continue his education in Grantham and prepare for entry to Cambridge University. Though not an outstanding student at school, Newton read extensively and impressed those around him. Acquired good proficiency in Latin and Greek at school. He was great in making mechanical devices which were greatly admired for their detail and precision.
In July 1661, Newton was admitted to Trinity College, Cambridge University and remained there for the next 35 years. The university in the seventeenth century was primarily a religious institution, its curriculum bogged down in the Middle Ages with Aristotle's work forming a major part. Earth was at the centre of the Universe - Copernican theories had no place in the university. Newton wrote about his lessons: 'Good friends are Aristotle and Plato, but a greater friend is truth'.
In 1663, Newton met John Wickins, a like minded student. They did not fit in the cultural environment of the university, became room-mates for the next twenty years. Wickins acted as his assistant and amanuensis (scribe). Newton largely ignored the official university curriculum of classics, Euclidean geometry (Newton found it too simple) and Aristotelian philosophy (largely discredited by Newton's time). Instead Newton wrote down a list of about 72 topics for his investigations - both experimentally and theoretically - 'Certain Philosophical Questions'.
Newton graduated with a BA in 1665 and returned to Woolsthorpe where he got trapped for two years by the raging plague affecting Cambridge.
We shall look at the scientific/professional life and latter years of Isaac Newton in Part 2...
Just When Did Newton Die?

Sunday, 1 December 2019
Making Sense of our Climate Change: 3. The Science of Global Warming
Index of Blogs and Courses
Parts 1 and 2 may be accessed here.
The Sun and the earth's atmosphere are the main players in determining the surface temperature of the earth. The primary source of energy is the Sun while the atmosphere acts like a blanket to keep some of the energy trapped on earth and maintain its temperature at about 14C. Without the atmosphere, the temperature of the earth will be -18C and life on earth will be nearly impossible.
A complex set of physical processes on earth's surface (land and water) and in atmospheric gases determine the equilibrium temperature of the earth. Earth's temperature will stay constant if total energy received by the Earth equals total energy lost by it.
It is a question of energy budget - any imbalance will heat or cool the Earth - its climate will change.
Slide 1 shows a simplified picture of the energy budget of the earth
SLIDE 1:

Energy from the Sun arrives mainly in the form of visible and infra-red (IR - longer wavelengths) radiation and has to pass through the atmosphere before reaching the earth. Atmospheric gases are largely transparent to visible light and most of it reaches the earth's surface where about 50% of it is reflected back into space, the rest is absobred by water and land. Clouds do reflect some of the solar energy back into space.
In its turn, the earth radiates energy in the form of IR that is efficiently absorbed by the greenhouse gases (GHG) in the atmosphere (water vapour, carbon di-oxide, methane and nitrous oxide). GHGs then emit the absorbed energy isotropically (equally in all directions) and a large fraction of the energy is radiated towards the earth where it is readily absorbed. It is this 'blanketing effect ' of the atmosphere that keeps the earth at 14C instead of -18C that it would be in absence of the atmosphere.
Some energy is also transferred to the atmosphere from the earth by water evaporation and warmer gases rising into the atmosphere.
I have drawn Slide 2 to show the main processes involved in determining the earth's energy budget and slide 3 shows the Greenhouse effect - it makes the earth about 30C warmer:
SLIDE 2: Earth's Energy Budget

Slide 3: The Greenhouse Effect

The Science of Greenhouse Effect:
Let us look at the science behind the processes described in Slide 2 leading to the greenhouse effect. A large number of science concepts are required - thankfully at the school science level. We start by stating that the radiation energy from the Sun is in the form of electromagnetic waves with wavelengths in the ultraviolet (UV), visible and infrared (IR) region (Slide 4).
SLIDE 4:

UV rays are the most energetic and exposure to them over extended periods is harmful. The ozone layer in the top atmosphere absorbs most of the UV and shields us from their harmful effects.
All bodies radiate energy in the form of electromagnetic waves - the energy radiated per second (power) dependes on the surface area and temperature of the body (Stefan-Boltzmann Law) and the range of wavelengths emitted is given by the Planck distribution curve. Note that the temperature is the absolute temperature of the body in unit of Kelvin and is related to degree centigrade as: T (Kelvin) = T (C) + 273. The situation is demonstrated in Slide 5.
SLIDE 5:

The total energy radiated per second from a given area increases very rapidly as the temperature, T, of the body increases - as fourth power of T. Doubling the temperture increases the energy emitted by a factor of 16. Sun's surface is about 20 times hotter than the earth; and per unit area, the Sun radiates 160,000 times more energy. Also the Sun is much bigger than the earth.
We also notice that the wavelength at which peak energy is radiated depends on the temperature of the emitting body. There is a simple relation called the Wien's displacement law that tells us where the maximum intensity of the Planck curve is:
Wavelength (max intensity) in microns = 2898/Temperature in Kelvin
Remember: 1 micron = millionth of a meter = 0.001 mm; and T (Kelvin) = T(C) + 273
We can summarise the discussion by plotting the spectral distribution of radiation from the Sun and the earth. In Slide 6, the Sun's radiation intensity has been scaled down to compare its shape with the earth's emitted radiation. The main take away is that the Sun radiates in regions around the visible wavelengths while the earth's radiation is totally in IR extending from 4 to 70 micron wavelengths.
SLIDE 6:
 Earth's Atmosphere
The earth is surrounded by gases to a height of about 100 km. Most of the mass of the atmosphere is in the first 20 km and this lower part of the atmosphere plays the pivotal role in determining the climate of our planet. The main constinuents of the atmosphere are gases and some fine particles (aerosols). I refer you to my lecture on the atmosphere for a detailed discussion (click here) and restrict the current discussion to the way greenhouse gases (GHGs) help to warm the earth.
The main GHGs are water vapour, carbon di-oxide, methane, nitrous oxide and ozone. Gases consist of a large number of molecules which are capable of absorbing electromagnetic radiation of specific wavelengths - each molecule has its own fingerprint called the absorption band. For radiation (from the Sun or the earth) passing through the body of a gas (as in our atmosphere), the gas is transparent to wavelengths which do not lie in the absorption band of this particular gas. Wavelengths which are in the absorption bands are absorbed by the gas molecules - what fraction of radiation is actually absorbed depends on the number density of the molecules (concentration og the gas in the atmosphere) and on the probability of absorption (called the cross-section). Slide 7 shows how this works:
SLIDE 7:

We notice that different GHG gases absorb radiation at selected wavelengths. Earth radiation is centered around 15 micron where carbon di-oxide has strong absorption bands. Water vapour is also effective at longer wavelengths at the upper end of the earth's radiation. Slide 8 gives a more detailed breakdown of absorption efficiencies of different GHGs and the total for the atmosphere. For more details click here.
Slide 8:
 This completes the objectives of this part. The role of water vapour is rather complex as its amount changes regularly and it is expected that this change will continue in the future. This essentially assumes that water vapour will continue to affect the warming of the earth the same way as it has done in the past. However, one needs to notice that in the global warming scenario, oceans will evaporate more water and possibly there will be more water vapour that can accelerate global warming. A counterbalance to this might be provided by increased cloud cover - clouds reflect Sun's radiation and prevent it from reaching the earth that might result in a net cooling effect. Water is a potent GHG and there is much controversy about its overall effect on global climate. I have discussed the relative roles of water and carbon di-oxide in global warming in a separate publication.
For a discussion of different types of clouds and how they affect solar radiation, you can look at my lecture by clicking here.
The other important GHGs are carbon di-oxide and methane; for the past 200 years the concentration of these has gone up significantly. Research has established that they are put into the atmosphere by burning fossil fuels and other human activities. Similarly much increased use of fertilisers has caused an increase of another potent GHG - nitrous oxide.
Parts 1 and 2 may be accessed here.
The Sun and the earth's atmosphere are the main players in determining the surface temperature of the earth. The primary source of energy is the Sun while the atmosphere acts like a blanket to keep some of the energy trapped on earth and maintain its temperature at about 14C. Without the atmosphere, the temperature of the earth will be -18C and life on earth will be nearly impossible.
A complex set of physical processes on earth's surface (land and water) and in atmospheric gases determine the equilibrium temperature of the earth. Earth's temperature will stay constant if total energy received by the Earth equals total energy lost by it.
It is a question of energy budget - any imbalance will heat or cool the Earth - its climate will change.
Slide 1 shows a simplified picture of the energy budget of the earth
SLIDE 1:

Energy from the Sun arrives mainly in the form of visible and infra-red (IR - longer wavelengths) radiation and has to pass through the atmosphere before reaching the earth. Atmospheric gases are largely transparent to visible light and most of it reaches the earth's surface where about 50% of it is reflected back into space, the rest is absobred by water and land. Clouds do reflect some of the solar energy back into space.
In its turn, the earth radiates energy in the form of IR that is efficiently absorbed by the greenhouse gases (GHG) in the atmosphere (water vapour, carbon di-oxide, methane and nitrous oxide). GHGs then emit the absorbed energy isotropically (equally in all directions) and a large fraction of the energy is radiated towards the earth where it is readily absorbed. It is this 'blanketing effect ' of the atmosphere that keeps the earth at 14C instead of -18C that it would be in absence of the atmosphere.
Some energy is also transferred to the atmosphere from the earth by water evaporation and warmer gases rising into the atmosphere.
I have drawn Slide 2 to show the main processes involved in determining the earth's energy budget and slide 3 shows the Greenhouse effect - it makes the earth about 30C warmer:
SLIDE 2: Earth's Energy Budget

Slide 3: The Greenhouse Effect

Let us look at the science behind the processes described in Slide 2 leading to the greenhouse effect. A large number of science concepts are required - thankfully at the school science level. We start by stating that the radiation energy from the Sun is in the form of electromagnetic waves with wavelengths in the ultraviolet (UV), visible and infrared (IR) region (Slide 4).
SLIDE 4:

UV rays are the most energetic and exposure to them over extended periods is harmful. The ozone layer in the top atmosphere absorbs most of the UV and shields us from their harmful effects.
All bodies radiate energy in the form of electromagnetic waves - the energy radiated per second (power) dependes on the surface area and temperature of the body (Stefan-Boltzmann Law) and the range of wavelengths emitted is given by the Planck distribution curve. Note that the temperature is the absolute temperature of the body in unit of Kelvin and is related to degree centigrade as: T (Kelvin) = T (C) + 273. The situation is demonstrated in Slide 5.
SLIDE 5:

The total energy radiated per second from a given area increases very rapidly as the temperature, T, of the body increases - as fourth power of T. Doubling the temperture increases the energy emitted by a factor of 16. Sun's surface is about 20 times hotter than the earth; and per unit area, the Sun radiates 160,000 times more energy. Also the Sun is much bigger than the earth.
We also notice that the wavelength at which peak energy is radiated depends on the temperature of the emitting body. There is a simple relation called the Wien's displacement law that tells us where the maximum intensity of the Planck curve is:
Wavelength (max intensity) in microns = 2898/Temperature in Kelvin
Remember: 1 micron = millionth of a meter = 0.001 mm; and T (Kelvin) = T(C) + 273
We can summarise the discussion by plotting the spectral distribution of radiation from the Sun and the earth. In Slide 6, the Sun's radiation intensity has been scaled down to compare its shape with the earth's emitted radiation. The main take away is that the Sun radiates in regions around the visible wavelengths while the earth's radiation is totally in IR extending from 4 to 70 micron wavelengths.
SLIDE 6:

The earth is surrounded by gases to a height of about 100 km. Most of the mass of the atmosphere is in the first 20 km and this lower part of the atmosphere plays the pivotal role in determining the climate of our planet. The main constinuents of the atmosphere are gases and some fine particles (aerosols). I refer you to my lecture on the atmosphere for a detailed discussion (click here) and restrict the current discussion to the way greenhouse gases (GHGs) help to warm the earth.
The main GHGs are water vapour, carbon di-oxide, methane, nitrous oxide and ozone. Gases consist of a large number of molecules which are capable of absorbing electromagnetic radiation of specific wavelengths - each molecule has its own fingerprint called the absorption band. For radiation (from the Sun or the earth) passing through the body of a gas (as in our atmosphere), the gas is transparent to wavelengths which do not lie in the absorption band of this particular gas. Wavelengths which are in the absorption bands are absorbed by the gas molecules - what fraction of radiation is actually absorbed depends on the number density of the molecules (concentration og the gas in the atmosphere) and on the probability of absorption (called the cross-section). Slide 7 shows how this works:
SLIDE 7:

We notice that different GHG gases absorb radiation at selected wavelengths. Earth radiation is centered around 15 micron where carbon di-oxide has strong absorption bands. Water vapour is also effective at longer wavelengths at the upper end of the earth's radiation. Slide 8 gives a more detailed breakdown of absorption efficiencies of different GHGs and the total for the atmosphere. For more details click here.
Slide 8:

For a discussion of different types of clouds and how they affect solar radiation, you can look at my lecture by clicking here.
The other important GHGs are carbon di-oxide and methane; for the past 200 years the concentration of these has gone up significantly. Research has established that they are put into the atmosphere by burning fossil fuels and other human activities. Similarly much increased use of fertilisers has caused an increase of another potent GHG - nitrous oxide.
In the next part (part 4) we shall look at some of our planet's vital signs that are affected and may even be used to quantify the warming.
Please pass on the the link of this blog to your friends and family.
Please pass on the the link of this blog to your friends and family.
Subscribe to:
Posts (Atom)