
Parts 1, 2 and 3 may be accessed here.
Scientific evidence for warming of the climate system is unequivocal.
- Intergovernmental Panel on Climate Change (IPCC)
In Part 3, I had discussed how greenhouse gases (GHGs) trap and send back some of the heat energy radiated from the earth. The result is a warming of the earth's temperature. In this part we shall look at some of our planet's vital signs that are affected and may even be used to quantify the warming.
Concentration of GHGs in the earth's atmosphere has been increasing for the past 200 years resulting in a corresponding rise of earth's temperature. This is widely attributed to the much enhanced human activity since the first industrial revolution - for example, the phenomenal rise in the use of fossil fuels to power the manufacturing industries, internal combustion based road and air transport and mechanisation in agricultural (I shall discuss how we empirically identify human involvement/contribution in global warming in Part 6).
Earth's temperature can also change due to natural causes such as variations in earth's orbit around the Sun affecting the amount of solar energy reaching the earth. These variations, called the Melankovich Cycles have long time periods and have regularly affected earth's climate in the past. Another natural cause might be changes in Solar energy output or changes in cosmic rays intensity. Scientific studies have ruled out the possibility (as some claim) that changes in earth's climate since the year 1800 are wholly due to such natural variations; and have strongly (and convincingly) implicated human activity to be the major driving force behind recent global warming.
Following three slides show the data:

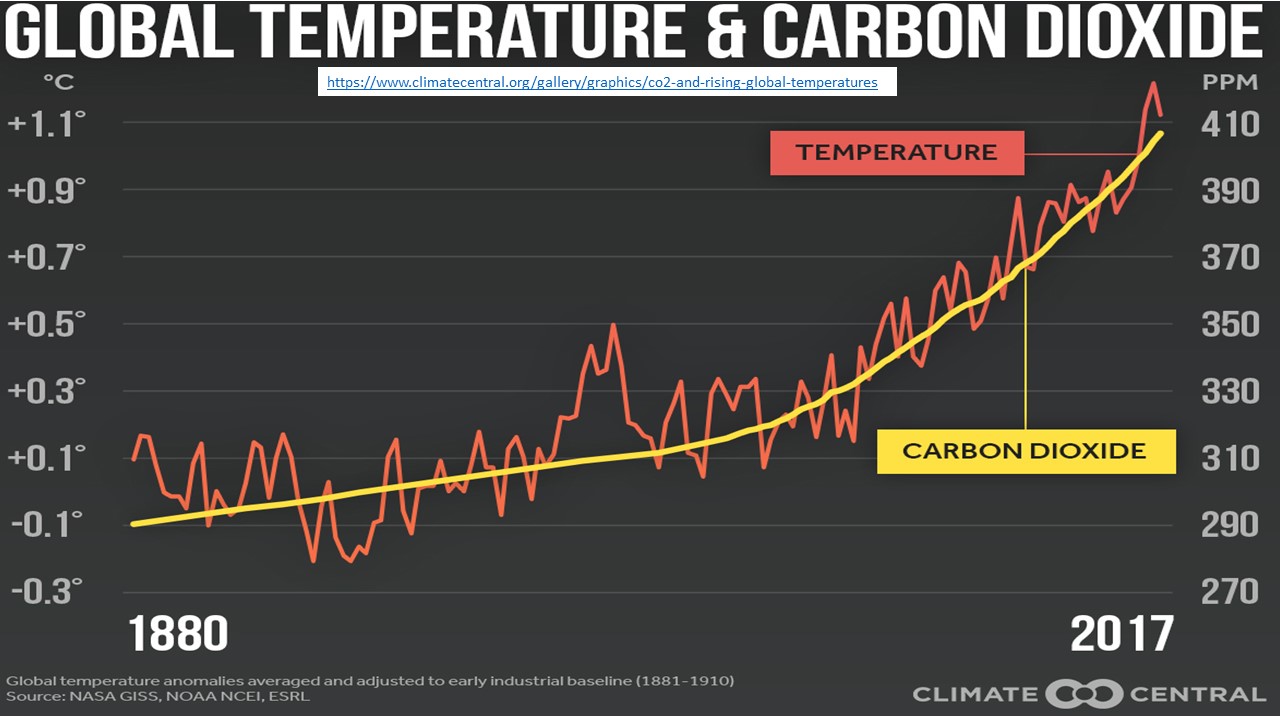
The concentration of other greenhouse gases has also increased - the figure below shows an exponential increase (red panel) since the industrial revolution when both the human population and industrial activity burning fossil fuels really took off.

A credible model of what has been happening is described below:
The use of fossil fuels (coal, oil and natural gas) mainly releases carbon dioxide (CO2) into the atmosphere where it resides for a period of 200 years or more. Some 50% CO2 is absorbed by the oceans and land plants, while the rest half mixes with the gases in the atmosphere. Increased atmospheric CO2 concentrations return a larger fraction of earth's IR radiation back to the earth to be absorbed mostly by the oceans - oceans become a sink for this extra heat energy - and cause warming of its surface temperature. The extra thermal energy is distributed throughout the globe by air circulation currents - increasing the land and atmospheric temperatures also. The result is a general increase in global heat content and its temperature.
Besides burning fossil fuels, many human activities like deforestation, excessive use of nitrogen based fertilisers etc. are causing loss of forests, soil erosion, environmental pollution, habitat & bio-diversity loss and much more. In tandem with climate change, the result of these human activities have serious deleterious effects on life on earth.
How Global Warming Affects Things on the Ground?
What are the Indicators?
I mention some of the indicators below
Global Warming leads to the melting of ice in the cryosphere - mountain glaciers melt faster, ice cover in the Arctic and Antarctica is reduced. Mountain glaciers supply freshwater to almost 2 billion people - their disappearance will be catastrophic for the supply of drinking water and for irrigation to the communities affected.
The sea water volume expands due to increased temperatures. Also additional water is added to the oceans by melting ice sheets and glaciers. Greenland ice is melting seven times faster than it was 25 years ago and is equivalent to a sea-level rise of 7 mm/decade. The sea-level increase threatens to inundate coastal cities where large populations live.
The sea at a higher temperature holds more energy and engenders more powerful hurricanes.
Wind patters are affected causing variations in rainfall and drought patterns throughout the globe.
Higher land temperatures evaporate more water from the land and trees in forests, making the wood drier. This enhances the frequency and severity of wild fires.
Absorbed CO2 in the oceans makes them more acidic leading to a decline in coral health and other sea-life.
Animal habitats are affected. Many animal species move to the colder temperatures at higher latitudes because their traditional habitats have become too hot.
Insects can now survive in many northern regions that were too cold for them in the past. Many of the tropical diseases borne by these insects are beginning to spread to new regions - people in these regions have little or no immunity to such diseases.
Species living in year-round icy conditions have no where to migrate to and will eventually become extinct.
It is concerning to note that all of these expectations (I have not listed all of them here) have transpired and the data available points to global warming as the underlying cause. Ironically, over the past few decades, most data indicates globe warming is increasing at a faster rate - the situation is getting worse - and many scientists are very worried about the future catastrophes that out of control global warming might deliver to the human civilisation and even cause much irreversible damage. Concerned scientists and international bodies have been putting out warnings about the urgent need to control and reverse climate change.
I end this part with some graphs showing the most important trend. Human population is the driving force behind increased consumption and is the most important parameter whose trend is strongly upwards. The global population has to come down for the global warming and climate change to be reversed. There are few sign of this happening as the next two slides show:


By UN projections, the annual growth rate will decrease from the peak of 2.1% in 1950 to 0.1% in 2100. This is still an increase. The exponential growth, even for this minuscule looking number, will double the population to 22 billion in year 2800 and to 44 billion in year 3500. The population pyramid shown in the second slide is unnerving when one realises the age structure in year 2100 compared to 2018. While there will be some increase of population in 0 to 35 age group, most numbers will be added to the older ageing population above 60 years. There will be about 800 million people of age 80+ years. How this will be managed is anybody's guess - certainly world leaders do not ever talk about these matters - it is a problem of the future - that is the tragedy of sustainable development.
Along with human population, the number of the ruminant livestock (raised for their meat) has been increasing by almost 1% per year over the past 50 years; per capita meat consumption also increasing by this amount. These animals require a lot of water, land, food and energy resources, and these have been increasing accordingly. For example, Amazon rain-forest is being lost at 2.4% per year (to grow animal-feed and corn for bio-fuels) and the global tree cover loss (to create new farming land) has been a staggering 5% per year since the year 2000. Forests are one of the most efficient sinks of CO2 - their loss translates into less CO2 absorbed from the atmosphere and hence more global warming. Accelerated global warming is exactly what we have been observing over the past decades.
The world business model is that of perpetual growth. In absence of growth, the global monetary system will come crashing down and growth must be maintained at all costs. Growth means higher energy consumption that in turn means higher GHG emissions leading to increased global warming. It is a vicious cycle and some miraculous leap of technology is required to break it. None is on the horizon and there is not much time left to act decisively.
In Part 5, I shall discuss the Carbon Cycle, and in Part 6 we shall look at the evidence that most of the recent global warming is caused by human activity. The evidence is based on radiocarbon studies and we shall look at the science of radiocarbon and stable isotope analysis of climate indicators.
No comments:
Post a Comment