About Me

My photo
Science communication is important in today's technologically advanced society. A good part of the adult community is not science savvy and lacks the background to make sense of rapidly changing technology. My blog attempts to help by publishing articles of general interest in an easy to read and understand format without using mathematics. You can contact me at ektalks@yahoo.co.uk

Tuesday, 16 October 2018

Additive and Multiplicative 3X3 Magic Squares - Construction and Some Not So Well Known Properties


I had discussed a couple of party games with 4x4 magic squares that have proved really popular among friends and in gatherings. Magic squares have fascinated people for thousands of years - they have an aura of mysticism and intrigue that is irresistible.
Wiki's article on magic squares comes with a lot of historic background etc. (also see 1, 2).  In this blog, I wish to concentrate on the additive 3x3 magic squares - particularly on their construction and its less well known relative - the multiplicative magic square (MMS), and describe some other interesting variations. I shall end this blog with a discussion of the majestic 16x16 magic square constructed by Benjamin Franklin more than 200 years ago.

Let us look at magic squares with sequential numbers.
 A general way to find the number in the central cell is described in the next slide


 I shall now discuss two variations of the magic squares that are not well known, but have really interesting properties.

The Multiplicative Magic Square:  In the magic squares that we have considered so far, the numbers in each row, column and diagonal add up to the same value. In a multiplicative magic square, the product of the numbers in each row, column and diagonal has the same value.


This is from Wiki:

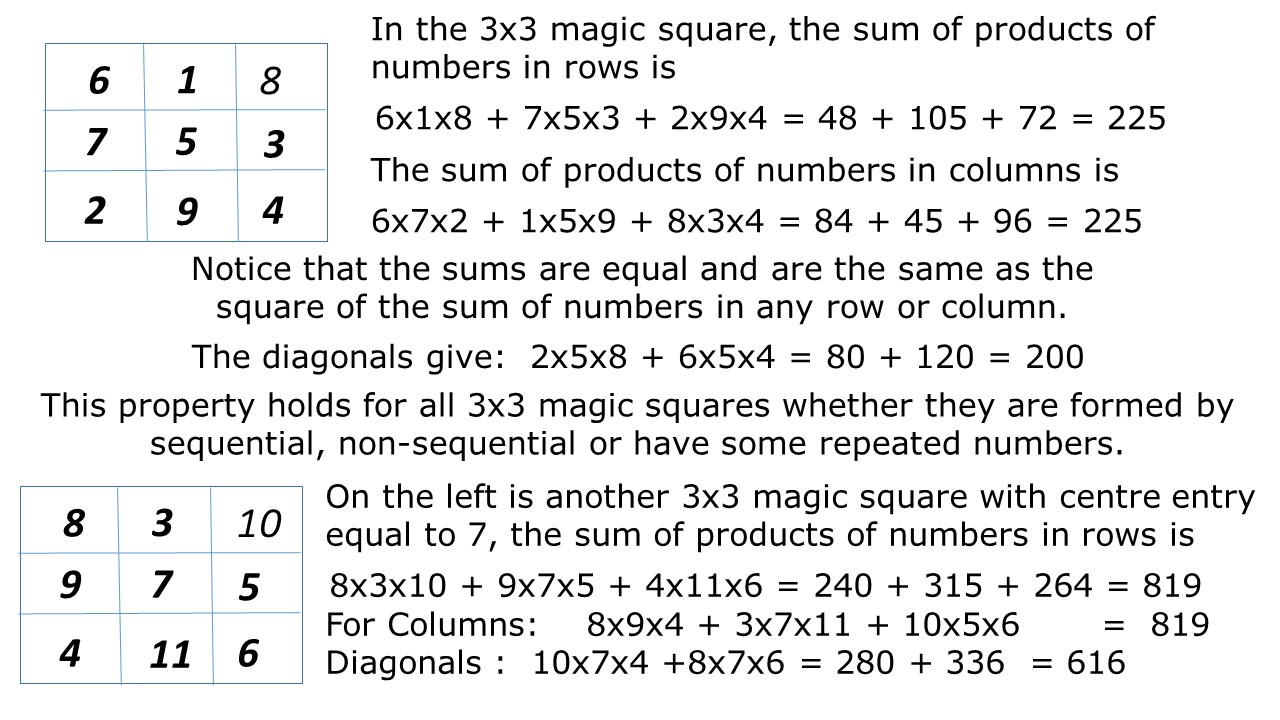
Sum of Products of Rows and Columns in a Magic Square:  This is a property of magic squares that is relatively unknown.  It was analysed by Professor Hahn in 1975.  Essentially, in an additive magic square, the sum the products of numbers in each row is equal to the sum of products of numbers in each column. 
Hahn shows, in a rather formal looking paper, that this property is always true for a 3x3 magic square but only holds for some (balanced) 4x4 and higher order magic squares. I refer you to the paper that is available online to read.

A second important point here is that the sum of products of numbers in rows or columns is not equal to the sum of products of numbers in the diagonals. 

I could algebraically prove these results for a general 3x3 magic square but the calculation is too long and tedious to present here.
I give some examples in the following:


The Majestic 16x16 Magic Square:  Professor Bill Richardson has described this magic square that was constructed by Franklin more than 200 years ago - without the advantage of computers!!  I refer you to the 1991 publication for all the details.  In the following is a brief summary:
The 16x16 magic square is shown in the slide:


https://en.wikipedia.org/wiki/Magic_square

https://ektalks.blogspot.com/2016/03/variations-on-magic-squares-interesting.html

Saturday, 6 October 2018

Obesity in Children - Weight at Ages 3 to 6 is Critical in Determining Obesity in Later Life

A year ago, I had reviewed Obesity that has reached epidemic proportions globally and is projected to increase significantly in the future.  Obese adults find it almost impossible to reduce weight, and are at greater risk of many illnesses like high blood pressure, diabetes, gout, heart disease, strokes, some cancers, joint problems, osteoarthritis, breathing problems, problems with sleep, gallstones and more. The association between obesity and depression is also well established. 

It is widely appreciated that an overweight child is more likely than a child of normal weight to be obese as an adult. Childhood obesity has been increasing an an alarming rate with a 10 fold increase in the past 40 years and this does not bode well for the global health in the future.    

A study of over 51000 children  has looked at the dynamics of BMI changes in children and adolescents and come to some interesting conclusions that your weight between ages of 3 and 5 is an important determinant of your adult weight.  This study may pave the way to control the growing scrouge of obesity in the world. 

I present a slide to define BMI before discussing the results of the study. 

  
We shall assume that 95th percentile defines the boudary of obesity.  The chart shows that a 20 year old with BMI of 30 (95th percentile) is obese, while a child at age 10 with BMI of 20 is in the 95th percentile and may be classified as obese. Children in the 5th percentile are underweight. 

The body-fat content of a healthy full-term infant rises from 10-14% at birth to 25-30% at 6 months of age - with a consequent increase of 30% in BMI. This is to support normal physical body and brain development.  After peaking at 6 to 12 months of age, BMI declines to a low value at 5 to 6 years of age and then rebounds (adiposity rebound) - rising throughout late childhood and adolescence.

I refer you to the study for detailed analysis but present their results in the following.

1.  90% of children obese at 3 years of age were overweight or obese in adolescence.
2.  Among obese adolescents, greatest acceleration in annual BMI increments occurred between 2 and 6 years of age.
3.  53% of obese adolescents had been overweight or obese from 5 years of age onwards with BMI increasing further with age.
4.  Most of the adolescents with normal weight had always had a normal weight throughout childhood.

Points 1 and 4 are crucial results that indicate that your weight as a young child (age 3 to 6 years) predisposes you to a particular body weight as an adolescent and, it might be safe to state, also as an adult.

How to control childhood obesity:  From slide 1, one notes that obesity started its upward march from about 1970.  Lifestyle has changed a lot since then and one wonders if there is some serious relation between these two.  My previous blog has looked at some sensible steps that one can take to control obesity increase.  The present study highlights the need to act when the child is between 3 and 6 years of age.  Advice about nutrition is fine but it is only a small part of the overall picture.  Regular exercise is very important in maintaining good body weight.
Use of hand-held electronic devices must be rationed for children as they encourage sedentary habits.  Sleeping times that synchronize with circadian rhythm might be something to work on as this could help in weight control and fostering general health.

Parents are too busy these days to generally provide good wholesome care for the children. 
I would be very interested in your ideas about how to control weight gain in young children.   
********************************************************************
http://ektalks.blogspot.com/2017/10/the-disease-called-obesity-what-is-it.html


Friday, 21 September 2018

Perimeter and Area of Regular Polygons - From Triangles to Circles - The Iso-Perimetric Theorem

Index of Blogs    Who Am I?

The Iso-Perimetric Theorem (IP Theorem; iso - same perimeter) concerns with the relation between the perimeter and the area of two dimensional (2-D) surfaces - plane figures.  For a historic account click here. A rigorous proof of IP Theorem is complex (see also) - I shall present here proofs that only need school level mathematics. 

IP Theorem may be stated as follows:

a. Among all 2-D shapes with the same perimeter, a circle has the largest area; or equivalently - 
Among all 2-D shapes with the same area, a circle has the shortest perimeter.

A short 2 minute video on youtube has a demonstration of the IP theorem.

For polygons (2-D shapes with n sides; n ≥ 3), IP Theorem may be stated as:

b.  For an n-sided polygon (fixed n; n-gon) with the same perimeter, the regular polygon (all sides of the same length) has the largest area.
c.  Among all regular polygons (any n) with the same perimeter, the one with the largest number of sides (largest n) has the largest area.
A circle may be considered a regular polygon approaching infinite number of sides and has the largest area for a given perimeter (points b and c). Statement c is thus equivalent to statement a of the theorem. 

A corollary of the IP Theorem may be stated as

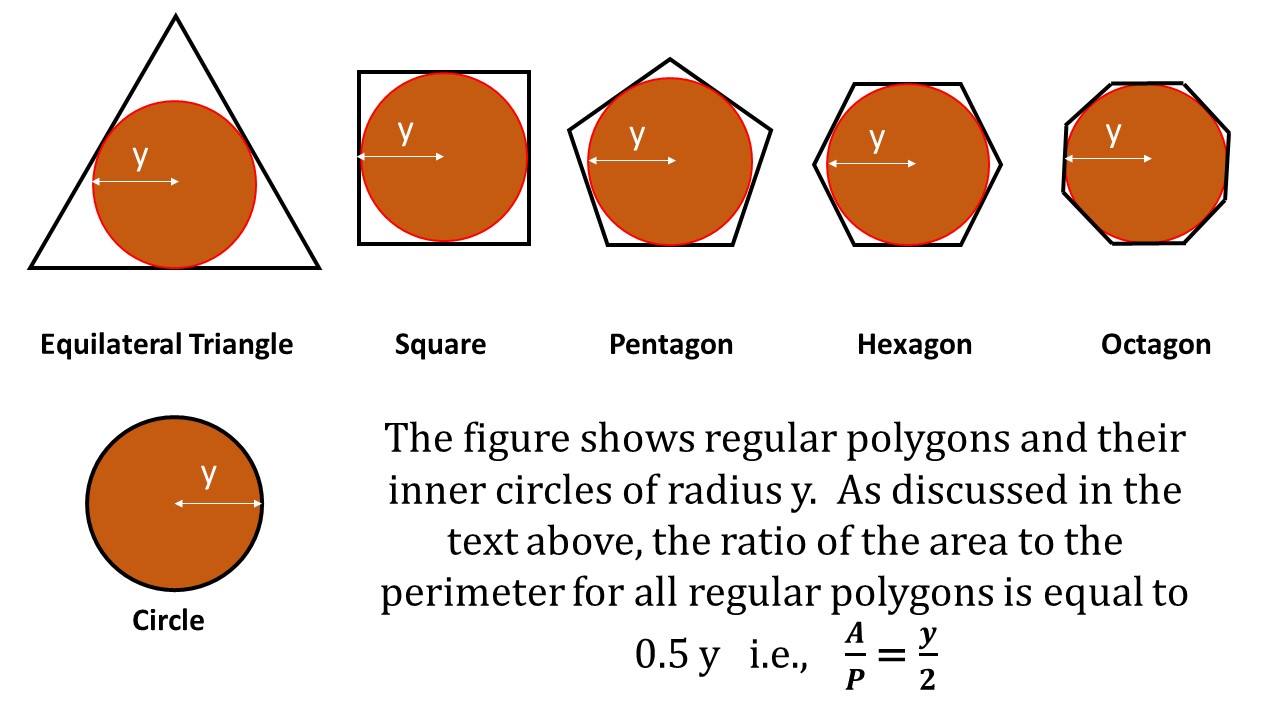
d.  For a regular polygon for arbitrary n, the ratio of its area to its perimeter is equal to half the radius of the inner circle (half its apothem).

About Polygons:  The following two slides list the properties of regular polygons.  They relate the area and perimeter of n-sided polygons to their basic parameters like side length, circumradius and the apothem.  Centre of a regular poygon is the point that is equidistant from all vertices of the polygon - it is the centre of the circumcircle.

(Click on a slide to see full page view, Escape to return to text)
Slide 1

Slide 2
Eq.7 gives us the ratio of the area A to the perimeter of a regular polygon.  For a given parameter P, the maximum value the ratio (A/P) may have, is r/2 and that is for a circle for which n tends to infinity and cos (𝜋/n) = 1. For all other values of n, area A of the polygon is less than Pr/2. I show this in the next slide


Slide 3

We can make an interesting observation, from the graph on this slide:  The ratio of the area and the perimeter of a regular polygon is equal to half the length of the inner circle radius (the apothem). This result is independent of the number of sides in the polygon. Length of the apothem y does increase with n according to eqns. 1 and 2; namely y = r cos(𝜋/n).


Slide 4

We also notice that the circle has the largest area for a given perimeter (A/P approaches 0.5 r as n tends to infinity).
In the above, we have proved statements a, c and d of the isoperimetric theorem. Next let us look at statement b.

Regular n-gons have the largest area for a given perimeter:  To understand this, we use a heuristic approach and look at triangles formed on a chord in a circle with the vertices of the triangles on the circumference. See the following two slides:


Slide 5

Slide 6

 The Equilateral Triangle:  We shall use algebra to show that 
for a triangle (n = 3), for a given perimeter an equilateral triangle has the largest area.  
I shall use the well known Heron's formula for area of a triangle.

Slide 7
Slide 8

The Square:  First we look at the general four-sided polygon (a quadrilateral) and show that the rectangle (all internal angles equal to 90 degrees) has the largest area for a given perimeter.  Then we use the 
 AM-GM theorem (the arithmetic mean of a set of numbers is always greater than or equal to their geometric mean) to show that of all rectangles, a square (a regular 4-gon; all sides are equal and angles = 90 degrees) has the largest area.
Here, I have followed the analysis by Martin Joseffson in Geometricorum 13, 2013, 17-21

Slide 9

Slide 10


An interesting historical remark is that the formula K = (a+c)/2 x (b+d)/2 was used by the ancient Egyptians to calculate the area of a quadrilateral, but it’s only a good approximation if the angles of the quadrilateral are close to being right angles. In all quadrilaterals but rectangles the formula gives an overestimate of the area, which the tax collectors probably didn’t mind!

AM-GM Theorem: I now show that the largest area for a rectangle is for a square when all four sides are equal. 
Slide 11


Notes:  
1.  I have considered convex polygons in the discussion.  For completeness, I present a slide to explain the difference between a convex and a concave polygon.

Slide 12

2.  I find the case when y = 2 very interesting and have prepared a slide to show the numbers for some polygons. Please refer to slides 1 and 2 for notations.
Slide 13
In a circle, the inner and circumradius are always the same.  

3. I have drawn all the slides in this blog.  You can use them but acknowledge the source of this blog as 
http://ektalks.blogspot.com/2018/09/perimeter-and-area-of-regular-polygons.html

Sunday, 9 September 2018

The Rise of Tech Companies - Threat to Privacy and Freedom - Cyber Dystopia

Index of Blogs, Who Am I?

There are two good things in life; freedom of thought and freedom of action.
                                                       Somerset Maugham (1915)
Slavery is the complete and absolute subjection of one person to the control and disposal of another person, by legalized force.  S.P.Chase (1844)

The last fifty years have seen a sea-change in the way digital technology (DT) has affected practically all aspects of our lives.  Thanks to DT, many things we can do now would have been science fiction even a few decades ago.  Improvements in communications, transport, medicine and other areas have palpably transformed the way we live and interact with each other. 

Technological capabilities -  data processing speeds and miniaturisation of equipment - are growing exponentially and have enabled the tech companies to gain position of influence in the market place.  
    
Notwithstanding the positive effects of DT on everyday life, negative aspects of DT have concerned many people. Loss of privacy and decline in sociability have probably been the most serious so far. In the very near future, every aspect of our lives will be recorded and archived - our digital profile will be available at the click of a button.  The question is - who owns this information?  The owner will have enormous power to control and manipulate people to his/her best advantage.  

In this blog, I wish to discuss the current situation and wonder if we have already passed the point when reclaiming our freedoms - freedom of thought, action, decision making, access to unbiased information - is unlikely.  It might already be too late to save the global human society from the enslavement by a handful of tech giants. It is a scenario that is worth exploring. 
Let me first explain the situation:

***********************
You might find the following article of interest too.. (Feb. 2020)

Tech Companies' Market Dominance:   In the capitalist system, company size is important in giving power and influence on policy makers.  The rise of tech companies over the past 20 years has been phenomenal.  For  example in 1997, Microsoft was the only tech company in the top 10 global companies by capitalisation.   It was third with net worth of $160 billion.
The following two slides show the top 10 companies in the world in 2010 and in 2018. Capitalisation is in Billion US $.


Tech companies have moved up the ladder in the past eight years to completely dominate the markets.  Besides Apple, the other six top companies were founded in the past 20 years - this is phenomenal rate of growth by historic standards.  Additionally, the top tech companies are all based in USA or China. 
  
Dominance of the economy by a sector is considered bad for obvious reasons - the companies in the sector carry unduly large influence on the development of free markets. For example, energy companies dominated the market in the 20th century.  Abusing their dominant position, energy companies had prevented and continue to impede the development of new energy sources - they were able to manipulate the energy production and supply to their advantage. The resulting damage to the environment and global climate is well documented.

The financial strength of big companies allows them effective lobbying and influence on policy decisions at governmental level.  They can buy out smaller promising start-ups to stop any disruptive innovations.  The mission statement of traded  companies is that they operate to maximise the return for their shareholders - welfare of the environment and people at large is secondary.    

But Tech Dominance is Different:  Big companies in traditional sectors like energy, transport, finance, food, etc. exploit their strong position by manipulating the consumer choice and behaviour - mostly through advertising, suppressing competition and lobbying for favourable regulatory regime.  The man on the street is affected directly, but the effects are limited in their scope.  We can choose to travel by car, train or plane depending on the convenience and cost.  Essentially, the market is governed by competition among the companies in a sector - the size of the biggest companies might allow them to bend the rules more favourably.  

The tech company dominance is very different from the traditional scenario.  Until about 1990, the role of digital technology (DT) was functional - it helped traditional industries in areas like word processing, automation, messaging and general computing.  Computer manufacturers (IBM) and software providers (Microsoft) grew rapidly. Then, the personal computers arrived - portable and powerful devices. 

In the past 20 years, the Internet has grown into an interconnected spiderweb of billions of personal, government, educational and commercial computers and devices. The world-wide web (WWW) - the greatest collection of knowledge in human history - is the information sharing part of the Internet. 
The Internet is also used for emails, messages, file transfers etc. and has allowed unprecedented advance in communication among private individuals throughout the world.
  

The Internet and IoT result in gigantic amount of data to be created - Big Data.  Big Data is controlled and is available for analysis by the big tech companies.  Essentially, in the near future no aspect of our lives will be private and a complete physical and mental profile of the world citizens will be available to the controllers of Big Data.  Profiling happens just now and one sees that in targeted advertisements, news delivery etc.  Most people use social media and happily provide detailed personal information and do not appear to worry about the loss of privacy.

Smart phones record your location 24 hours of a day, they keep a record of your conversations, messages made to your contacts - not much you do in a day in communicating with others is private any more.  
In not too distant future, mosquito-sized drones will be able to infiltrate any location you are in and can transmit information about all you do.  This is a given in the surveillance society we are already happily marching towards. 

Face-recognition technology is improving rapidly.  In due course, even if you have left the smart phone at home, you can be identified by CCTV mounted everywhere.  You shall not be able to hide. 

Eventually, may be in the next 20 years or so, your thoughts could be read by devices in the vicinity.  Already, it is claimed that your eyes are a good guide and disclose what you might be thinking.  But, the capability to capture electromagnetic signals from your brain activity will be the final link when you lose privacy of thought.  

Enslavement of the Global Population:  Digital technology makes possible enslavement of the global population and the signs of this happening are already visible.  

a.  Manipulation of thought:  Internet has vastly diluted the differences among different cultures.  We are spending more and more hours looking at the Internet and reading/learning the same contents irrespective of where we are.  A child in India does not think much differently anymore than a child in UK.  Sadly, these days parents are too busy to provide wholesome upbringing to their children - but Social Media and Internet are there to help.  Additionally, we are relying on DT to provide us with personal entertainment in the form of music, games etc. Try to spend a day without your smart phone and TV - this is even more acute for children when they are at their most sensitive stage in life. 

Essentially, DT already provides a big chunk of entertainment and cultural education for children and they are very happy to accept material from the Internet in preference to interacting with their peer group.  They are not acquiring the social skills that they would learn in the past by mutual interaction with others in the society.  More seriously, our thoughts and personalities are now open to manipulation by those who control the material on the Internet.

b.  Life in Cyber Space:  Interesting developments are happening in augmented reality (AV) and virtual reality (VR).  Essentially, it will soon be possible for one to experience whatever one wishes - you may be travelling in a space ship, climbing Everest, going on a date with Miss Universe or have best seat to watch your favourite sport. All at the flick of a button - or may be by just thinking about it.  Life in cyber space can be a very happy and pleasant experience.  But powers who control the Internet will use it not only as a marketing tool but also as a reward and punishment strategy.

c.  Cyber Apartheid:  At present 1% of the population owns about 85% of the wealth.  Many of these people are very influential and interestingly they would also own shares in the big tech companies and support how the companies operate.
The rich 1% can also buy cyber expertise.  Essentially, they can afford the most luxurious life style in the real and in cyber space. 

On the other hand, only a tiny fraction of the world population is STEM savvy. Here, we have a situation where most users of Internet and smart phones and other electronic gadgets do not have much money and do not have the know-how to understand the intricacies of what they are using (poor and naive!).  They have also no where to hide in terms of information relating to their physical and thought profiling. Their cultural background and information sphere is being manipulated to a high degree. 
A good fraction of the world population is ready for exploitation and control. Ironically, vast majority of people may still feel happy - they will have good food, good entertainment and good VR friends.  As long as they do what the Internet masters wish them to - and it seems there should be no problem in it - life could be pretty satisfying. They will also not know how the rich live and there would be no reason to feel jealous or unhappy with your lot.  This is similar to how Aldous Huxley envisioned a ruling oligarchy could amuse the masses into submission with a mind numbing drug (Soma) and endless casual sex.   

"... most men and women will grow up to love their servitude and will never dream of revolution" - Aldous Huxley (1949) letter to George Orwell
"None are more hopelessly enslaved than those who falsely believe they are free." - Goethe (1809)

Of course those, who might stray and have independent thoughts, will not be able to hide and fight back to change the system.  They would be treated harshly and eliminated. The reach of surveillance society will be complete.   

Could things work out differently?: I have discussed a scenario on the basis of current state of digital technology and trends.  The current technology can not be un-invented - it is to stay with us and hope to grow exponentially in the foreseeable future. The unknowns mainly relate to the development and impact of artificial intelligence.  It is mooted that within the next 10 to 30 years, AI will reach human-intelligence levels (AGI), also called strong-intelligence. 

Many experts have argued that at some stage, AI will be able to reprogram and improve itself.  A cycle of recursive self-improvement can be very rapid, it will also be unstoppable.  The intelligence explosion will lead to the emergence of super artificial intelligence (SAI) - a technological singularity where SAI may be able to invent/discover anything.  SAI will be superior to AGI what human intelligence is to microbes!

SAI might decide not to support the continued existence of humans and their institutions. Even if we can program, from an early stage, a friendly version of AGI leading to SAI, it is a moot point as to how long before it will reprogram itself.  If you were a million times more intelligent and resourceful - would you wish to preserve Boris J. and Donald T. of this world? 
  
Final Word: This work has come out of some crazy thoughts and I have written it because I do feel that we are sleep walking into some sort of cyber dystopia.  The scenario I have painted might be completely off the point but thinking logically always seems to push me back to it.  
Love to hear from you - ektalks@yahoo.co.uk

Update:  November 2019:  A vivid example of how digital technology is being used in China to control the islamic population in Xinjiang province (Reference:  Nature).  'Mass Internment and Arrest by Algorithm'.  The article in Nature states:

...the AI-powered policing platform purports to predict crimes based on computer generated findings alone.  ...  The system is able to amass vast amounts of intimate personal data through warrantless manual searches, facial-recognition cameras..'.
Through the collection of large-scale data run through AI and machine learning, the algorithm can ... predict ahead of time, places of 'crime' and possible perpetrators. 
With batteries of facial-recognition cameras on street corners, endless checkpoints and web of informants, the 'programme' generates a sense of omniscient, omnipresent state that can peer into the most intimate aspects of daily life.

The example above is sure to be repeated throughout the world.  Governments love control - using big data and suitable algorithms just makes so much sense! 

The above example is using opressive methods of Orwell's 1984.  I think, Huxley's Brave New World had a much better way of controlling people - at least everybody stays happy.

Cyber Dystopia has almost arrived...Good luck.

Saturday, 11 August 2018

A Simple Estimate of Global Mean Sea Level Rise due to Increase in Global Temperatures


Who am I?  Index of Blogs

During the 20th century, mean sea-level rose by about 10 cm and is expected to rise at a much faster rate in future. Rising sea-level increases the intensity of severe stroms and  tides causing serious flooding.  Cities and infrastructure near coastlines are vulnerable to damage. Rising sea-level also increases the risk of coastal erosion and shoreline retreat. 

Climate change is given as the reason for the accelerated rise in global mean sea-level and under current scenarios, we should expect a further rise of 60 to 100 cm by the year 2100.  For a lay person, it is difficult to relate a warming climate to a sea-level rise, and how the estimates are made might appear confusing.  

In this blog, I shall calculate sea-level rise due to melting of ice on land and thermal expansion of water. Both estimates may be reliably made using school level arithmatic.  I shall use  numbers rounded to two decimal places to make the calculations look tidy.

Thermal Expansion of water:  Water expands with rising temperature. For each degree centigrade rise in temperature, the volume of water increases by a factor equal to 2.14 x 10-4.   The average sea surface temperature is 17oC and during the 20th century the surface water temperature  increased by ~ 0.5oC. 

The interesting part of this calculation is to appreciate that the water temperature in the sea drops steadily with depth and reaches 4oC
 at about 700 m.  At 4oC, water has the highest density and sea water below 700 m does not change much in temperature - hence does not expand in volume and does not contribute to sea-level rise. 


When the sea warms, it is mainly the layers up to 700 m depth that warm and expand.  We can calculate the increase v in the volume V of water  when the temperature changes by dT.  Since the surface area A of the sea may be assumed constant, the increase h for dT = 0.5oC
 is  
                
                  v = 2.14 x 10-4 x 0.5 x V 
or               h A = 2.14 x 10-4 x 0.5 x 700 A
or               h = 0.075 metres = 7.5 cm in 100 years 

Over the past 20 years, the global warming rate has accelerated and it is estmated (IPCC 2013 Report) that in the next 100 years the sea level will rise by at least 20 cm due to thermal expansion of water (IPCC Senario RCP4.5).

Melting of Ice on Land:  At present, glaciers cover 10% of the land area and store about 75% of world's fresh water (of all the water on Earth, only about 2.5% is fresh water).  Twenty thousand years ago, at the peak of the last ice age, glaciers covered ~32% of the total land area!  
Ice is also present in the sea in the Arctic Ocean; but the  melting of ocean ice, as in the Arctic Ocean, does not change the sea-level.  It is only the land ice that can add additional water to the seas and cause its level to rise.
Ice on land is present in inland glaciers and ice sheets - the Greenland Ice Sheet (GIS) and Antarctic Ice Sheet (AIS). So far, the inland glaciers have contributed the largest amount of  melt-water; IPCC estimate (5th asssessment report 2013, chapter 13) that melting inland glaciers will contribute 12 ± 6 cm sea-level rise by the year 2100. 
  

The Greenland Ice Sheet, GIS covers 80% of Greenland surface and has an area equal to 1.7 million km2, its thickness on average is 2 km.  GIS is losing ice quite rapidly; during the decade 2002 to 2011, the average ice loss was 215 billion tons per year!

Antarctic Ice Sheet, AIS is much bigger.  It covers 98% of Antarctic continent and has an area 14 million km2, and is up to 4 km thick at some places.  It contains 26 million billion tons of ice.  While most parts of the ice sheet are considered reasonably stable, over the past few years, loss of ice from West AIS has been increasing and is currently about 80 billion tons per year.


Before we calculate the rise in sea level due to melting of the ice-sheets, let us note that the Earth has a surface area of 510 million km2. Of this about 71% is ocean - 360 million km2 and the land is 150 million km2.


GIS is losing 215 billion tons or 215 x 1012 kg of ice per year (1 ton is equal to 103 kg).  The density of ice is 917 kg m-3. Therefore, volume of water produced per year =  215 x 1012/917 or 2.35 x 1011m3.  
This water will raise the level of sea by 2.35 x10¹¹m3/ 360 x 1012m2  = 0.653 mm per year
In 100 years GIS will increase the sea level by 6.5 cm.
However, it is expected that the rate of ice loss will increase significantly due to continued warming of the planet resulting in a much greater rise of global mean sea level due to GIS ice loss. 

The amount of ice lost per year by the Antarctic Ice Sheet is about 80 billion tons per year and will contribute only 2 cm to the rise of sea level over the next 100 years. This might be a gross underestimate of what could happen if our planet continues to heat up.  AIS has large areas of ice plates (shelves) projecting over the sea with their base in contact with the sea water (the grounding line). Warmer sea water is already melting the underside of these plates and adding extra water to the oceans. See slide.


The grounding line also moves inland increasing  the probability of thinned ice shelves breaking and falling in the ocean to raise sea levels. IPCC 2013 report estimates that, by the year 2100,  this (Ice Sheet Rapid Dynamics) can add 10 cm to the sea level rise. 

But what happens if all of the GIS and AIS melt over the next few hundred years.  How much the sea level rise be?

Considering that GIS is on average 2 km thick and covers an area 80% of 1.71 million km2; the volume of water that the ice in GIS will generate is 2.5 million km3; The resulting sea level rise will be 7 metres.  At 250 billion tons of ice lost per year, it will take GIS 10000 years to melt completely; however, the melting rates are expected to increase and many scientists think that GIS might melt away within the next 1000 years. The 7 meter sea-level rise will be catastrophic for our civilisation. 

See Also: https://www.bbc.co.uk/news/science-environment-48337629 
              May 21, 2019 report
See also https://www.nationalgeographic.com/environment/global-warming/sea-level-rise/
                           February 2019
Interesting Read:  https://edition.cnn.com/interactive/2022/04/world/climate-sea-level-rise-iceland-marshall-islands-cmd-intl/