Pages

Thursday, 29 December 2016

Disruptive Innovation - Part 2 - Electric Vehicles shall Substitute the Current 'Not Fit For Purpose' Road Transport System


Blog Content - Ravi Singhal Profile      Category:  Future Technology
       
(Click on a slide to see its full size image - Esc to return to text)

"The way we drive cars has not changed much over the past century. Finally, new technologies are about to completely redefine how we travel. Autonomous vehicles will be a disruptive game changer."
In Part 1, I had looked at disruptive innovation (DI) in transport during the 19th and 20th centuries.  I wish to extend the discussion to point out the current shocking state of transportation and how the situation is ripe for a new entrant to substitute automobiles running on fossil fuel.  Certain conditions are necessary for quick adoption of DI - I feel that such conditions are now in place.  We have a transport system - I am referring here to road transport infrastructure - that is overcrowded, inefficient, highly polluting, unsafe and inconvenient to use.  At the same time, the necessary technology for electric vehicles (EV) - battery technology, miniaturized sensor/digital devices and network software - has reached a maturity level that EVs look very attractive and have started to become competitive in the traditional car market.  EV and its younger sibling, the driver-less car or autonomous vehicle (AV), promise to remove most of the negative features of the current transport system. 

The idea of a driver-less car (AV) is that it will operate under software control with zero human input. Getting rid of a human driver has potential advantages: Computers don't get drunk, don't get distracted by kids, don't rush when they are late, with computers driver fatigue is completely eliminated.  AVs will obey traffic rules which are designed for safe, efficient driving. In fact, with AVs, one would not need to own a car but sharing it will make far more sense and will be highly economical - you are not paying a driver! Shared AVs - let us call them aTaxis - will 
  • reduce the number of cars on the road by 50% 
  • seriously cut down on pollutant emissions - help climate change too 
  • allow freedom of movement to disabled and old people and also the very young
  • free passengers to use the travel time for personal purposes
  • more comfortable rides - smoother acceleration and braking
  • reduce the number of accidents by 90%
  • by platooning - reduced distance between cars - increase fuel efficiency and also significantly increase highway capacity
  • shared EVs will greatly reduce the need of parking spaces
      • will allow land in cities to be used beneficially - for housing, parks etc.
      • train station parking will not be necessary, allowing all day greater use of commuter trains

Present Car Infrastructure is not fit for purpose:  

It is highly Inefficient:  Currently, a car travels about 30 miles a day with an average speed of 30 miles per hour - in use for 1 hour per day.  It stands idle for >95% of the time and carries only 1.6 occupant on average.
Much of the time on the road, the car is either stationary or crawling - this is inefficient use of fuel and transport infrastructure.  I tell about my personal experience:

My daughter lives in a town 20 miles outside London.  She allows half an hour to drive the 1.3 miles to the train station in the morning.  When visiting her, I offered to do the driving and during one week, she missed the train two times (it wasn't because I was driving!) - it took 35 to 40 minutes to cover 1.3 miles.  The petrol consumption over the whole week was 22.3 mpg instead of the expected 42 mpg.

The road infrastructure is in place, but most of the time only a few cars are using it - less than 5% of the time roads are used to their full design capacity.  This is inefficient.

It is highly Polluting:  Less than 1% of the fuel energy is used in moving the car from A to B - the rest is wasted.  Both petrol and diesel vehicles emit pollutants.  Carbon-di-oxide has been responsible for climate change, oxides of nitrogen are damaging to health. Particulates from diesel cars have large surface area, they efficiently adsorb chemicals - many of them harmful - and find their way into the lungs and aggravate health issues like cancers and premature deaths.  


It is Overcrowded:  Our city roads are congested because of car traffic.  We have all experienced the frustration of driving from A to B during peak rush hours.  Many useful productive hours are wasted sitting in traffic jams.  Global urban population is projected to increase from 3.8 billion in 2010 to 6.5 billion by 2050.  1.5 million people are added to the urban population each week! Cities are going to get geographically bigger and overcrowded.  Transport infrastructure is already inefficient and will get even more so in the future.

It is Unsafe:  IN USA, 5.5 million transport related accidents are recorded of which 93.6% are due to human error.  They result in 33000 deaths (globally 1.2 million die per year), 2 million hospital visits and $300 billion in lost productivity. Why is our society accepting the epidemic of car crashes!!

It is Wasteful:  Average family in OECD countries spend about 17% of annual income on automobiles.  A car owner spends £0.50 in UK ($0.90 in USA) to drive her car one mile. The average car occupancy is 1.6 

What are the Reasons for Poor Transport Conditions:  Only humans are to be blamed for the poor transport infrastructure and inefficiency that it represents.  In my view, car manufacturers and oil conglomerates have conspired to block the development and adoption of alternate technology and have used their lobbying power to the fullest extent to frustrate attempts to shift to alternate technologies and foster better, more pragmatic use of auto transport.  The mantra of 'personal transport' has been successfully sold to all and our society is wedded to the idea of car ownership - even though 96% of the time it is not moving - a good example of how to waste resources.  A consequence of personal car ownership culture is that efficient and good public transport systems did not develop properly to address the needs of our society.  Rather, we have a transport system that is inefficient and not fit for purpose.  It is failing to meet the current needs of the society and the situation is likely to get much worse. It is a two trillion dollar industry and it is a shame that people who control these companies are unable to see the fast approaching day of reckoning. Unfortunately, highly inefficient systems are most vulnerable to disruptive innovation and the current road transport is an ideal target for DI. 

Cars as Personal Transport:  'Breaking the link between ownership and access is a vital stepping stone to adopting AVs'.  Ownership of cars by individuals is valued highly in our society.  Globally, there were 1.2 billion cars in 2014, with car ownership expected to double to 2.5 billion by 2050 - in the business as usual scenario.  Also, the road length appears to have reached saturation levels in OECD countries. The result is that congestion will increase in time - it is already a serious problem.  Shared cars will help to significantly moderate the problem of congestion. Studies suggest that if everybody used shared vehicles then the number of vehicles required will drop by at least 50%.  Already in cities, many people do not own cars and use buses or other public transport.  This trend will continue.  Shared taxis reduce the expense of going from A to B considerably but increase journey time and require a greater acceptance of a move from personal transport.

Electric cars as the new disruptor:  Electric cars have been around for a long time - they were not suitable for personal road transport because technology lacked a way of storing energy to provide an acceptable driving range.  This has now changed and a 200+ miles range between charging the car battery is now possible.  Battery technology is expected to improve further along with a network of battery charging points; it is widely accepted that electric vehicles have passed the tipping point needed for their adoption as a reliable means of transport.  EVs are still expensive with small cars priced around US$40,000.  This should come down as volumes and competition increase.  Cheverlot Bolt, is probably the most versatile of EVs available at present and is described in the following two slides:
(However, see also the newly announced car Faraday Future with bigger range and specifications)


The Bolt, and many of petrol-driven cars, now incorporate many safety features which are being developed for autonomous (driver-less vehicles) and this trend will continue.The  take-up of EVs will increase rapidly.

Distracting Devices in Cars (featuritis):  
'you can't be looking at the road and the screen at the same time'.  
'In today's super-connected world, it seems driving is a distraction'
The operation of the car today is already controlled by a powerful computer - GPS, ignition control, adaptive cruise control, adaptive headlights, front crash prevention, parallel parking, lane departure warning and prevention, brake assist are some of the features available widely in cars. Many devices are fitted on dashboards, worn on wrists or body, carried on seats and pockets, HUDs - head-up displays are transparent screens that present data without requiring users to look away from their usual viewpoint.  These distract the driver and compromise safety. The trend of fitting features that are developed for AVs - like adaptive cruise control, lane-changing etc., gives a feeling of security that encourages the driver to be less attentive.  Many experts feel that partially automated vehicles are even more dangerous because the potential of distracting the driver; a transition from human driven cars to driver-less cars should be made not slowly in steps but as a quantum change.  Let us look at the AVs and discuss where we are:

Driver-less or Autonomous Vehicles will be a game changer and will be a true disruptive innovation with ability to substitute fossil fuel transport, hopefully, by around 2050.  AVs could reduce the number of cars by 50%, road traffic accidents by 90% and substantially cut commute time and wasted energy in transport. There is a body of opinion which claims that AVs will never happen because software could not possibly replace humans in making decisions on the roads and there are safety concerns relating to hacking of the car's computers.  I think such opinion make many valid points but the vantage point is not right. Technology is at its most efficient when faced with a specific problem - none of the problems in transport are insurmountable especially given the vast markets worth two trillion dollars and the current need to replace road infrastructure.  All factors required to spur technological breakthroughs are present including competition among several manufacturers developing AVs.  I do feel that AVs will totally replace human controlled cars at some stage - may be not by 2030 or 2040 as some claim, but very possibly in 50 years time.  

The Current Situation:  AVs have developed mainly over the past 15 years. Successful trials of AVs have been taking place - particularly by Google and Tesla. An AV was tested by Google in 2008 on a closed road at 25 miles per hour.  Today, the car can operate at 75 miles per hour in real-life conditions.  Listen to Google Self-drive car project here.  Google AVs have clocked over 1.7 million miles on designated urban routes and has been a great learning exercise.  Tesla has been installing AV software in their electric cars and have collected data over 1.2 billion miles under varied driving conditions. Autonomous trucks are being used successfully in mining for the past several years.

There are many outstanding issues to be resolved before a fully autonomous car could be ready for urban driving in all weather conditions etc.  Currently, AVs do not deal well with inclement weather - heavy rain or snow.  They also do not recognize new features in signaling or changes made on the roads to deal with emergencies etc.  Obviously there is lot more work to be done.  
The issue of security against hacking of AV's computer system is an interesting one.  A hack proof software is never going to be possible.  If one looks at the history of hacking computer systems, it is almost always to steal information. Controlling the software operation is not generally attempted.  That is why, systems of national importance like electricity grids, air traffic control systems etc. have operated satisfactorily for many years - but are no less vulnerable than the software in AVs.  Also hacking an individual computer is easier than a network of computers. Therefore, the problem of malicious acts against the network is real and in theory will always be a possibility; one has to develop procedures and checks to guard against external hostile acts.

Some Consequences of AV Dominance: There are some unexpected consequences if and when autonomous vehicles take the major market share.  If, as predicted, the number of cars is reduced to 50%, what will the current car manufacturers do?  Most of them wouldn't be making AVs anyway.  One could expect massive bankruptcies with loss of jobs.  In a shared-AVs society, taxi drivers will not be needed - another lot of massive loss of jobs.  On the other hand, many new jobs will be created in software and digital industry.  The situation will be interesting to say the least. 

I have also stated that AVs will allow freedom to travel to the disabled, very old and the young.  The extra demand will increase vehicle traveled miles (VTM).  This will create more pollution and also more congestion.  People might decide to live further away from city centres - increasing VTM further. It is difficult to quantify the increase in VTM at this stage but they could be significant.  Interesting times ahead.
However, remember Jevons Paradox:  An increase in efficiency tends to increase (rather than decrease) the rate of consumption of that resource.

Final Word:  The megatrend of substitution of current transport by autonomous vehicles is firmly established and all barriers to penetration of AVs into transport will be resolved over the next 50 years.  The initial stages will see AVs adopted in areas where the journeys are not complex - trucks in mining industry are already being used successfully.  Other promising area might be buses on long distance routes.  In the mean time, many features being developed for AVs will be installed in electric vehicles driven by humans.  This development could have distracting effects and can also generate feeling of security making human driven car journeys even more dangerous.  
At present, AV technology is expensive but with large uptake the cost will come down to about $3000.  To start with AVs will be shared cars - aTaxis - and people will not own personal vehicles.  This will result in a paradigm shift in the way we view transport.  
Rapid charging points with a sensible pricing structure is a pre-requisite for a wide adoption of electric cars. Governments and private enterprises are encouraging the development of such networks; hopefully, a viable network will be available within the next decade.  

More on autonomous vehicles a recent article - see and links therein.  

Will love to hear your comments - please send them to ektalks@yahoo.co.uk

Friday, 23 December 2016

Mathematical derivation/description of the exponential (limitless growth) and logistic (the S-Curve) functions (resource limited growth)


Blog Contents - Who am I?                   Blog Category - Mathematical Functions

The whole purpose of science is to find meaningful simplicity in the midst of disorderly complexity.                                                                Herbert A. Simon, Models of My Life (1991)

Exponential and logistic functions describe the time development of a quantity under specified conditions.  These functions are valid in a large number of situations - I present a mathematical derivation/description of their properties which is suitable for anybody who has a basic understanding of school level mathematics.  
By not using the phrase - may be shown - I hope this presentation will provide a better appreciation of this important subject.

(Click on the slide to view full page image, ESc to return to the text)

    The Exponential Function (EF) - limitless growth


I have discussed exponential growth in detail in a previous blog and refer you to this source for a comprehensive description. A good example of exponential growth is the nuclear chain reaction in an atomic bomb - the number of fission events and hence energy generated grows exponentially and explosion happens well before the device runs out of fissile material.  
Exponential growth is a fascinating subject and I have expanded the discussion at the end of this blog. For worked out examples - click here.

                     The Logistic function or the S-Curve 
                     (Resource limited growth)

Resource limited growth is a much more common situation found in many physical systems where the amount of energy, food, space, number of consumers etc. has limits.  The result is that after a certain time, the growth is restricted; eventually (asymptotically) reaching a zero rate. 
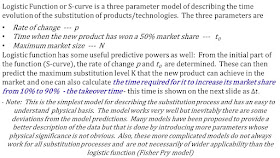
In the initial stages of growth, its works just like the exponential growth as there are sufficient resources but once roughly half of the resources are used, the growth starts to be restricted and the quantity deviates from the exponential function and is described by what we call the S-curve or the logistic function.  I shall set up the mathematics of the logistic function in the following.  For ease of presentation, I shall consider the substitution of an established business (incumbent) by a new entrant (disruptor) in an environment where the number of products to be sold is capped - The Fisher Pry Model. The results derived are of general applicability.

We assume that at the start the incumbent has a 100% market share with the cap at N products. The disruptor starts with 0% market share.  

After time t (units could be days, months, years etc.), their market shares are 
Disruptor -> D, Incumbent ->  I   such that  D + I = N

It is convenient to work with fractional market shares as follows: 
Disruptor -> F = D/N, Incumbent -> (1 - F) = I/N   such that the total market share is unit.

Once established in the market place, the fraction rate of growth of the disruptor depends on how much market share still remains to be won and we consider that this is directly proportional to the remaining market share (1 - F ) (remember in exponential growth the fractional rate of growth was constant).  The justification of this assumption is in its success in explaining substitution in a very large number of cases.


Returning to Exponential Growth with more details


There are three ways to describe exponential growth (EG) - they are equivalent but one is used in preference to others depending on the situation:  In EG

1. Rate of change (% Change) depends on the amount present (Fractional rate of change is constant) 
Annual interest rate is 5% (interest earned per year is 0.05 times the money at the start of the year). 
Inflation index which measures the % change in the cost of a basket of goods over a year, was 2.5%. 
Global population increased by 1.4% per year in the 20th Century.
E.Coli colony increases is size at 3.5% per minute.  etc...

2.  The quantity present doubles after a certain time.
(Doubling Time) 
If you leave your money in a bond, it will double in 14 years
Inflation will double the cost of goods in 28 years.
Global population doubled every 50 years in the 20th Century. 
E Coli colony doubles in size in 20 minutes.  etc...

3.  Doubling steps:  Accumulate something with the added amount doubling in successive steps.
In 70 years, there were 5 doubling steps for your money - money grew by a factor of 2^5 = 32 times
In 56 years, inflation had two doubling steps - prices went up by a factor of 4
In 150 years, population had 3 doubling steps - grew by a factor of 8
In 12 hours, E Coli colony had 36 doubling periods and grew by 2^36 = 68.7 billion times

The important parameter in exponential growth is
% rate of change or doubling time. 
Rate of change and doubling time are measured in the same units of time - be it years, minutes, seconds, centuries, nanoseconds or whatever. 
They are simply related as follows (called the rule of 70):

% rate of change = 70 divided by the doubling time, and of course
The doubling time = 70 divided by the % rate of change

If we start with 1 unit and the doubling time is T then at time

10T the number of units will be 1,000 (actually 1024; I have rounded up the numbers)
11T                                            2,000
20T                                            1,000,000
30T                                            1,000,000,000
40T                                            1,000,000,000,000 
41T                                            2,000,000,000,000
What quantity (population, money, no of transistors) and  the unit of time (years, seconds, minutes etc.) you choose  depends on the problem.

The thing to note is that at 10T after one doubling time, the growth was 1,000;
while at 40T after one doubling time, the increase was 1,000,000,000,000 - a billion times greater. 
This is true of all systems showing exponential growth - this is simple maths.

Also note that in each doubling time, the increase is as much as has happened since the beginning (in all the previous doubling steps). 
So when we say that energy consumption will double in 40 years; it means that in the next 40 years we shall consume as much energy as we have used since the beginning!  To make it clearer:
From 1970 to 2010 we used as much energy as we had used from 1800 to 1970.  (1800 is chosen as a reference point - energy used before 1800 was very small)

If we were to plot the quantity against time then the graph will show very little change in the beginning but after 10 or 20 doubling times the numbers would have grown to thousands of times bigger and the graph will show an almost vertical swing. For EG to really take off, one needs to wait for about 30 doubling times but then the absolute growth is at a phenomenal level.  For some worked out examples, click here.

If you found this blog interesting then let me know at ektalks@yahoo.co.uk

Saturday, 17 December 2016

Disruptive Innovation - Part 1 - Why it Succeeds?, How it Spreads?, S-Curve; Transport Infrastructures to Year 2000;


Blog Content - Who am I?    Category:  Self-Indulgence 
         (click on a slide to view full page image, Esc to return to text)

Disruptive Innovation (DI) is a process by which a product or service takes root initially in simple applications at the bottom end of a market and then relentlessly moves up market, eventually displacing established competitors.

DI is ruthless and spares nobody: Fortune 500 lists the most successful companies in the USA - of Fortune 500 firms in 1955 vs. 2015 - only 12% remain, thanks to destructive innovation.

How can DI destroy powerful, established companies? The answer really is in the way companies work tirelessly to improve and innovate existing products to increase their market share. A company with an established product range continues to improve the top-end of its market (sustaining innovation) chasing higher margins and profits. Funnily, the bottom-end  -  representing the bigger share of the market - is often left unattended.  This allows a new entrant (the disruptor) to take a foot-hold in the low margin part of the market. The successful entry of the disruptor is often made possible by some technology driven change - this process is accelerating due to the exponential growth in technological advances

Many firms now practice what is called self-disruptive innovation to ensure that new entrants face tough competition and do not grab market share from them by default. For example, even though it affects their current product range, GM and other motor companies are developing electric cars to provide tough competition to Tesla and other new entrants.

One also has to appreciate that the task of a disruptor is never easy.  A disruptor starts with little capital, frequently borrowed from friends and family; they may not be business savvy, the idea may not gain momentum and a very large number, ~ 90% of start-ups fail before making any impact (the valley of death - where start-ups go to die).  The figure below demonstrates how a disruptor might develop in time:

I have chosen to discuss the way transport has changed over the past couple of centuries as transport, energy and communications have been the most important elements in the development of the industrial revolution and still play a pivotal role in underpinning our civilization. Innovation in new energy sources from wood to coal to oil then gas is reflected in the form of disruption in transport by canals, steam, cars and planes. Of course, the technology environment also must be correct - e.g., for cars to replace steam engines, the availability of the internal combustion engine was a pre-requisite etc. 
It is interesting to note that technological innovation, transport system infrastructure and economic development are closely related.  Technological innovations create opportunities for the development of cheaper and faster modes of transport and new economic sectors leading to increased prosperity.  This is nicely summarized in the slide adapted from :
The following two slides show S-curve analysis of energy and transport infrastructures. I shall discuss S-curve in detail later in this blog, but feel that it is important to show these slides to demonstrate how new transport infrastructures grew and declined in consonance with new energy sources.   In the slides, the wavy lines are actual data, smooth lines are S-wave description of the data.  Figures are adapted from The Rise and Fall of Infrastructures by Arnulf Grubler (1990). 

An interesting observation from the first slide is that the demand of wood and coal dwindled not because the world ran out of wood and coal but because other sources of energy became available - technology based on the new sources was more advanced and efficient.  Oil as an energy source is approaching its peak demand and will be replaced in the near future by solar, wind and other renewable energy sources.

The S-curve:  Also called the Sigmoid (Sigma is the Greek letter for English S).  Pierre Verhulst (1804 - 1849) studied the population growth in Belgium and found that sigmoid curve correctly described the growth pattern.  Small populations grow slowly at first but then the growth increases exponentially (growth rate is proportional to the population size) as the resources are much greater than the demand.  This continues until the population reaches a level that stretches available resources - then the growth slows down eventually reaching a trickle.  This is what we call limits to growth. 
In biology, two species might compete for limited resources (food supply) and a competitive pattern emerges. The end result is that one species wins and replaces the other species completely - the dominance is described by a model developed by Volterra and Lotka in the 1920s.      

In transport, it is not the resource scarcity but the destructive innovation by new technology that limits the growth of the incumbent.  When a technology proves to be a better option - determined by its technological, economic and social credentials - competition will ensue resulting in a process by which the new technology replaces the old. (Fisher-Pry Model 1971 - a model similar to Volterra and Lotka model). They assumed:
1.  The process is competitive (try to win a bigger market share) aiming for the substitution of one method of satisfying a need by another.
2.  Once the new technology entry reaches a tipping-point - generally a market share of a few percent, it will proceed to complete take-over
3.  The fractional rate of substitution (fractional market share F) of the new technology is proportional to the remaining market share (1 - F) and follows an exponential trajectory.  
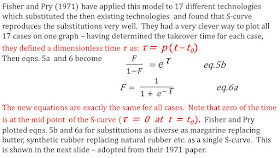
The next slide (adapted from Fisher and Pry's 1971 paper) shows the S-curve evolution of the substitution of an old technology by a new one in 17 different technology areas. Dimensionless normalized time is used to plot the two graphs. Also notice the y-axis log scale for the figure on the left. 

It is amazing that the Fisher Pry model works so well for a large number of disparate technologies. In the next slide, I summarize the equations involved in the model - 
The following slide is more mathematical and may be skipped without loss of continuity.


The result is an s-curve, also called the logistic function. This describes the rate at which disruptive innovation (DI) replaces an incumbent.  From the rate and early stage adoption, it is possible to predict the maximum market that the new technology will reach (the saturation value). 

We shall first look at examples from the transport sector and then muse how the substitution process actually comes about.  Analysis by Fisher and Pry shows  (see slide above) that DI in 17 technologies in very different sectors may be described very well by their model curve - what is actually happening on the ground is something we would like to understand.  

Some Historical Notes:  Until the 18th century, the transport infrastructure in the UK was poor - particularly travel and transportation of goods was very expensive and unsafe.  Few roads were suitable for wheeled vehicles - in fact in the early stages,  industrial revolution suffered due to a lack of proper transport infrastructure.  Canals and inland waterways were constructed to connect industrial centers to transport coal, wood and manufactured goods.  From the mid 19th century railways started to replace canals which reached a peak around 1890.  To replace canals, railways had to develop its own infrastructure of railroads - this was time consuming and very expensive.

Railways: Starting in 1825, the UK was the first country to develop the railroad infrastructure.  The rapid growth in railways was possible due to the simultaneous development in technology (steam engine), energy source (coal) and market forces (industrial revolution).  Other countries were not far behind - I shall discuss mainly the analysis of UK and USA railway infrastructures using the logistic curve (Fisher Pry model).
The following two slides show this analysis:


USA has the world's largest rail network - by 1930 when rail networks length was near saturation, USA had 480,000 km network. The global network was 1.256 million km. Interesting to note that time for the railways infrastructure to grow from 10% to 90% of its final saturation value is 57 years for both UK and USA - in fact it is roughly the same for most countries (Russia is an exception and expanded in ~40 years).  Also most countries reached a saturation value in about 1930.
Road Transport:  Automobiles:  Railways had to develop its own infrastructure - in contrast, cars had a vast network of roads, albeit not very good quality, in place - developed for horse driven vehicles.  DI by automobiles happened in two phases. Firstly cars replaced horses as the main means of local transport without seriously affecting the railways.   Starting in about 1910, in the UK and other developed countries, cars rapidly replaced horses with almost total substitution by 1930 (see slide below).  In the second phase of DI, starting after WWII cars substituted railways for long distance travel and transport of cargo etc.  The substitution process was slower than in the first phase and completed around 1980. In the slides below, the two phases may be seen on the global car ownership data.


Road infrastructure expanded in all countries in response to expansion of automobiles.  The first slide shows how the USA unpaved (rural) and paved road infrastructure grew in the past 100 years or so.  The next slide shows similar dates for the UK. (Road length in thousands of miles)


Understanding the origin of the S-Curve: Substitution of older transport infrastructures like canals and horses by railways and roads follows a symmetric S-curve with a takeover time - time for adoption from 10% to 90% of the social system - and is rather similar in different regions of the world. 
Businesses flourish by innovating new products to satisfy human needs of faster, efficient, comfortable, greater capability in range and reduced costs; but they operate in a complex environment that is a mixture of social, economic, and technological activity. A disruptive technology increases its market share by providing a superior product but still has to be accepted by members of the society - the adoption of the new technology follows an evolutionary pattern characterized by the S-curve.  Members of a social system have to make a decision about adopting or rejecting an innovation - they need information that has to diffuse through to them.  The quality and the rate of diffusion of the information determine the rate of adoption.    

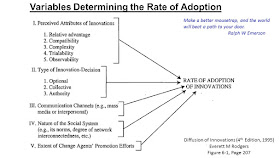
Empirically, the rate of adoption is quantitatively given by the slope of the S-curve at any point and  may be represented as in the slide:

Members of a social system may have vastly different expectations, value systems, communication networks etc., but they are sharing information and learning experience through interaction with other members in the society. This sets up a diffusion process that is more efficient for some members but may be not so for others.  The diffusion of knowledge and experience about the innovation from the early adopters to the general population has a time spread and contributes to the time evolution of the S-curve. 

The next stage is the use of the knowledge by members to arrive at the decision to adopt the innovation.  The relative advantage of an innovation, as perceived by members of a social system, is positively related to its rate of adoption. Rodgers (1995) has summarized the factors that affect adoption of innovations and I reproduce the relevant information from his book

DI  in transport (1830 - 2000):  Until the arrival of the steam engine and railways, horses and canals were the primary means of transport for people and goods. This was slow, uncomfortable and dangerous.  Railways infrastructure, which had to start from scratch in about 1830, increased along an S-curve trajectory  - the network length reaching over 1.3 million km (0.8 million miles) worldwide, saturating at the end of the 1930s. Railways permitted long distance travel at much higher speeds in conditions of relative comfort, and safety and was readily adopted globally.
Railways had a catastrophic impact on the quality of roads in the 19th century.  Horse driven transport could not compete with railways; in England and Wales the number of turnpike trusts (private enterprises for maintaining and constructing long distance principal road network) fell from 3800 in 1830 to 20 in 1886!   

Cars used an extensive road structure, although not of great quality, which were developed for horse drawn vehicles. Initially cars replaced horses in providing transport links to and from railways and transporting goods and services in rural and urban areas.  The adoption of cars in their complementary role to railways was rather rapid  - takeover time of ~12 years in the USA. Horses disappeared as significant means of transport by 1930.
A second phase of DI by car happened in the 1930s when closed body structures permitted long distance travel.  Cars started to compete with railways as the main means of moving passengers and goods. Cars were also more convenient for personal transport, short journeys and were responsible for a decline in railway infrastructure.

Many technological innovations have occurred in automobiles during the 20th century - automatic transmission (1930s), power steering (1951), air conditioning (1953), disc brakes(~1960), radial tyres (1968), electronic ignition(1972) and their adoption follows a standard S-curve evolutionary trajectory (S.T. Jutila and J.M. Jutila 1986). 

Final Word:  In this first part, I have discussed DI in transport with case study of railways and automobiles.  This brings us to the end of the 20th century.  I have deliberately missed the impact of air transport from our discussion as this would have made the blog too complex.  
In the second part, I shall look at the future of transport up to about 2050.  The disruptive innovation for surface transport of first the introduction of electric vehicles (EV) progressing to the adoption of autonomous vehicles (AV) is inevitable as all the hallmarks for a DI are present in the transport system. The current system suffers from congestion, noise, pollution, inefficiency of use of infrastructure, safety and much more. with the inexorable increase in urban populations through out the world, a new paradigm in personal transport and transport in general is inevitable - conditions are just right for a DI in surface transport
In comparison to the 19th and 20th centuries, the diffusion process is so much faster now due to efficient communication channels in our society.  This will make DI much more rapid and it will be interesting to see how private enterprise deals with the new situation.